
If you add a chart to a dashboard, it’s helpful to let people choose what they’d like to see in the chart. In this example, you’ll choose a date range, and select other criteria, and the interactive Excel chart automatically adjusts to show total values for the selected data.
Author: Debra Dalgleish
Excel Data Validation Error Messages
Do you like to use error checking in Excel, so that problem cells are flagged, or do you turn that feature off? There are options for data validation error messages too – do you use those?
Happy Spreadsheet Day 2016
Happy Spreadsheet Day 2016! Spreadsheet Day started in 2010, and we celebrate on October 17th every year, because that’s the date on which VisiCalc was first released, way back in 1979.
Quickly Close All Your Excel Files
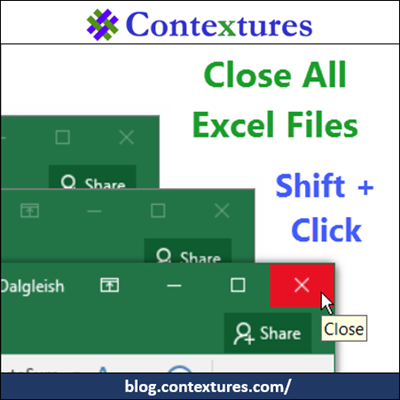
First, I’ve got two quick announcements, and then there’s a handy Excel trick for you. Are you ready for Spreadsheet Day 2016? Quick, close all your Excel files, and bake a cake!
Create a Schedule in Excel
This weekend is our Canadian Thanksgiving, and we’ll have 16 people here for dinner. To make sure that all the dishes are ready on time, I’ll use Excel to schedule everything that has to be done. We’ve been using this meal planner for years now, and would be lost without it!
Contextures Blog Update

After having all kinds of problems on the blog last week, I’ve installed a new theme. Everything looks different, including the header image. It’s a photo that I took on a vacation, and the blues and greens match the Contextures logo.
Excel Sing Along

It was a busy and stressful week, with all kinds of computer fun – plugin updates that killed my blog, a touchpad that refused to turn off, Outlook contacts all disappearing into the iCloud, lots of laptop restarts, and much, much more. Good times!
So, instead of something serious and educational, let’s have an Excel sing-along!
Dependent Combo Box in Excel
You can add a drop down list in a worksheet cell, so people can select from a list of valid entries. The font in that list is pretty small though, even if the worksheet is at 100% zoom. And good luck trying to read it, if you go to a lower zoom setting! My eyes aren’t that good, so I use a pop-up combo box, in some workbooks, to make the list easier to use.
How to Plan a Pivot Table in Excel
Setting up a pivot table is a bit like news reporting – you can give a quick summary of the Who, What, When, Where and How (Much) of your data. After you’ve been using pivot tables for a while, it’s easy to create a new report, and drop the fields into the right locations. But, if you’re just starting out, it’s not clear what to put where. I’ve put together a short guide on how to plan a pivot table.
Thanks to Anne Walsh for suggesting today’s topic! Anne has led Excel classes for many years, and she knows that people struggle to get their pivot tables set up correctly. Anne recently published Your Excel Survival Kit, which is jam-packed with useful Excel tips, from her extensive experience.
Good Old Days of Spreadsheets
A couple of things happened this week that reminded me of the good old days of spreadsheets. There are some good memories, but I really don’t want to go back to those days. How about you?