

Last week we had a giveaway, with the grand prize of Excel TV’s online course – Excel Dashboard Pro. To enter, you had to add a comment to the blog post, with the hashtag that you might use, if you needed help with a dashboard. There were prizes for runners up too, and you can see all the winners below.
Author: Debra Dalgleish
Excel Dashboard Course Giveaway
Are you an Excel Dashboard pro? If not, here’s a great opportunity to improve your skills. I’m having a giveaway, and a terrific new Excel dashboard course is the top prize. There are runner up prizes too, and a free video series.
How to Prevent Grouped Dates in Excel
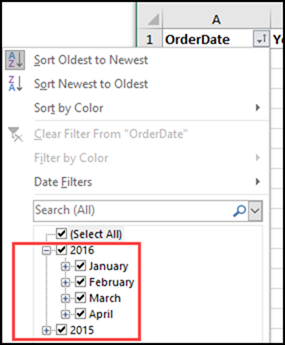
As a teenager, group dates can be fun. If you have strict parents, that might be the only kind of dates they allow! But, in your Excel worksheets, it can be annoying when dates are automatically grouped. This happens in AutoFilters, and in pivot tables too (in newer versions). Here’s how you can undo or prevent grouped dates in Excel AutoFilters and Pivot Tables.
Analyze Food Tracker Data in Excel
To keep track of what I’m eating, I use the LoseIt food tracker app on my iPhone and iPad. It’s easy to use, and creates nice summaries for each day and week. To see how things are going, I’d like to analyze that food tracker data in Excel, instead of being limited to the preset options in LoseIt.
Highlight Cells Based on Two Conditions
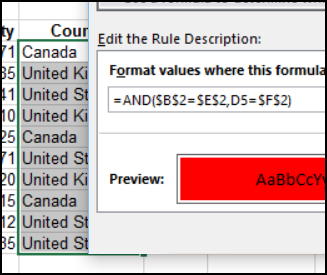
Happy New Year! I hope you had time to relax over the holidays, and you stepped away from the computer for a while. Unless you were using the computer as excuse to hide away from all the holiday chaos! Now we’re back to work, and one of the first questions I got this year was how to highlight cells based on two conditions.
Remove Excel Pivot Fields With Macros
If you’re rearranging a complex pivot table, it can take a while to manually remove each field. To make the job easier, you can remove Excel pivot fields with macros. There’s a sample macro below that remove all the column fields, and you’ll find more examples, and a free workbook, on my website.
How to Organize Your Excel Files
Are your Excel files carefully organized, so you can find what you need in a few seconds? Or, are things messy, and it takes a miracle to find anything later? If that’s the case, here are a few tips on how to organize your Excel files.
How to Make a Marimekko Chart in Excel
In a Marimekko chart, the column widths show one set of percentages, and the column stacks show another set of percentages. For example, show the size of market segments for computer sales, and company sales within each segment. See how to build a Marimekko chart in Excel, either manually, or with an add-in.
Take the Excel COUNTIF Challenge
Last week, in my Contextures Newsletter, I posted an Excel COUNTIF challenge. There were 100 codes on a worksheet, but when counted, the occurrences for each letter only added up to 99. What was causing the problem? Take the challenge yourself – download the workbook to see how you’d solve it.
Hide Used Items in Drop Down List
Don’t let Excel yell at us, if we accidentally enter a duplicate value in a column. Okay, maybe Excel isn’t really yelling, but it seems like that when a data validation error message pops onto the screen. Instead of letting people pick a duplicate, use this trick to hide used items in a worksheet drop down list. You can’t pick an item if it isn’t there!