In this video, sports scientist, John Lythe, shows how you can create 4 dynamic Excel charts in 10 minutes.
Or watch on YouTube: Make Four Dynamic Excel Charts in 10 Minutes
Excel tips and tutorials

In this video, sports scientist, John Lythe, shows how you can create 4 dynamic Excel charts in 10 minutes.
Or watch on YouTube: Make Four Dynamic Excel Charts in 10 Minutes
The Power Map feature was improved last month, and this short video shows some of the things you can do with custom maps in Excel.
Or watch on YouTube: 6 Cool Ways To Use Custom Maps in Power Map
In this video, Annie Cushing shows how to create a scrolling table, by using the INDEX function and a scroll bar form control. This technique would work nicely in a dashboard, where space is limited.
For more dashboard tips, take a look at Mynda Treacy’s Excel Dashboard course which has just opened for registration, until Oct. 23rd. Details are in the Announcements section, below.
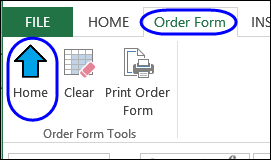
Are you building custom tabs for your workbooks yet? Last year, I wrote a couple of articles about custom tabs:
Continue reading “Add Your Own Icon to an Excel Custom Ribbon Tab”
I’ve seen lots of non-spreadsheet items with “Excel” in their names, such as gum, and bowling gloves, and hand dryers.
However, this is the first time that I’ve seen a product named after a pivot table. Do you think that they help you analyze your data more efficiently? I wonder if they have a women’s version too.
Kenneth Cole REACTION Men’s Pivot Table LE Oxford
(photo no longer available)
Here’s what I posted recently:
Here are a few of the Excel articles that I read recently, that you might find useful:
Here are some upcoming events, courses, recently published books, and other new items, related to Excel.
| Practical Numerical Methods for Chemical Engineers: Using Excel with VBA by Richard A. Davis“This latest 3rd edition continues to expand the breadth of practical numerical methods with over 100 VBA macros for extending Excel’s power for engineering & scientific analysis. Engineers & scientists will find the enhanced coverage of computational tools applicable to a variety of problems in their own disciplines.” | |
| Financial Modeling for Business Owners and Entrepreneurs, by Tom Y. Sawyer.”You’ll learn to create operational and financial models in Excel that describe the workings of your company in quantitative terms.” | |
 |
Excel VBA for Financials, 2-day course led by Excel experts, Jan Karel Pieterse and Tony de JonkerThis Dutch course is specifically aimed at the Finance professional. It has no frills, and no technical mumbo-jumbo – just the VBA you need to achieve more success in your daily job.Date: November 19 and December 3, 2014
Location: Utrecht (Netherlands) |
| Beginning Power BI with Excel 2013, by Dan Clark”Guides you step by step through the process of analyzing and visualizing your data. Daniel R. Clark, an expert in BI training and a regular speaker on these topics, takes you through each tool in turn, using hands-on activities to consolidate what you’ve learned in each chapter.” | |
If you read or wrote any other interesting Excel articles recently, or have upcoming Excel events, please share a link in the comments below, with a brief description. Thanks!
_____________________
______________
If you love Jambalaya, you’ll appreciate the Excel Jambalaya Calculator that Jay Crush has worked on for several years. He just released version 7.0, and you can read about the calculator, and get the file download link, in Judy Walker’s article in the New Orleans Times-Picayune.
I downloaded the file, and you can see a screen shot below. Now, if 150 people drop by for dinner, I’ll be able to cook up a giant batch! Please call ahead, to let me know if you’ll want a full plate, or just an 8 oz bowl.

Are you brave enough to enter the ModelOff competition, that tests your financial modeling skills in Excel?
To help you decide if you’d like to enter, there are workbooks with questions from previous years, available for download. For example, can you find and fix the errors in a complex workbook?

If you have Excel, do you even need any other programs? In this week’s video, David Buchanan, from the Chef’s Resources website, shows how to use an Excel workbook to plan every step in an event, from the idea phase, to prep and ordering, to recipes. I like his description of this process as “mental mise en place” worksheets, to help you organize tasks.
There is a free app available for Excel (2013 or Online version), that lets you create 8 different chart types, including some that aren’t standard Excel charts, such as box plots. The app is called XLMiner Data Visualization, and it’s created by Frontline Systems, which also makes the Solver add-in.
If you log in to your Microsoft account, you can download and install the app from the Microsoft Store. Then select data, and the chart appears in the app’s window. In the screen shot below, you can see the box plot chart that I created, in just a few seconds.
The free version of XLMiner lets you do the basics, and if you want more features, you can upgrade to the Pro version. It costs $995, about the same as Tableau Desktop. And if you want quick, fancy charts, at a much lower cost, take a look at Jon Peltier’s charting utility.

Does Ed Bott include your favorites in his list of 6 Excel power tips?
He included one of my favourites – Paste As Values. However, I usually Paste Values by dragging with the right-mouse button pressed, instead of using a keyboard shortcut. You can see that technique in the very short video below. Do you use the mouse or keyboard for Paste As Values?
Or watch on YouTube: Change Excel Formulas to Values With Mouse