
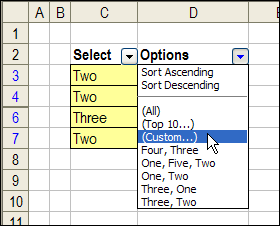
With data validation and some programming, you can select multiple items from a drop down list, and show the selections in a single cell.
Too Few Rows in New Excel Workbook
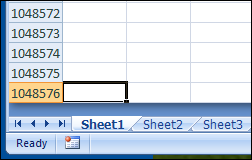
In Excel 2007 and Excel 2010, when you create a new workbook, there should be 1,048,576 rows on the worksheet.
Not Enough Rows
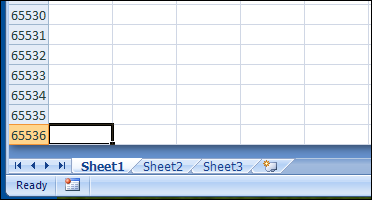
However, one of my clients was creating new files in Excel 2007, and the sheets only had 65,536 rows, just as they did in older versions.
Perhaps you don’t need more rows than that, but if you’ve paid for a shiny new version, you’d like access to all of its features!
Solve the Too Few Rows Problem
At first, we thought the problem might be an old Excel 2003 template, that was starting automatically, and being used for the new workbooks.
A search of all the Templates folders didn’t turn up any suspects, so that theory was wrong.
Default Save Format
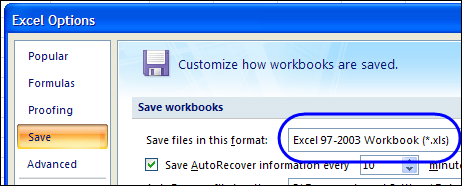
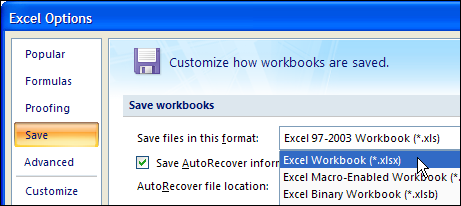
Finally, we discovered that the default format for saving files was set to Excel 97-2003 Workbook (*.xls).
Change the File Format Setting
To get the full-sized Excel 2007 worksheets, follow the steps below:
- First, go into the Excel Options.
- Then, at the left, click on the Save category
- Next, at the right, in the Save Workbooks section, select one of the newer formats as the default for saving files.
- Finally, click OK, to close the Options window
All the Rows!
After you change that setting, the problem should disappear.
Now, when you create a new workbook, its sheets will have 1,048,576 rows.
___________
Dynamic Dependent Excel Drop Downs
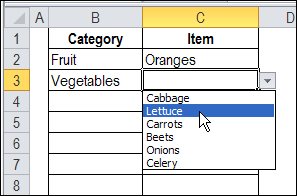
With dependent data validation, you can make one drop down list depend on the selection in another cell.
For example, select Vegetables as a category in column B, and you’ll see a drop down list of vegetables in column C.
Worksheet Data Entry or Excel UserForm
If you’re building an Excel workbook, in which users with basic Excel skills will enter data, would you create a worksheet data entry form?
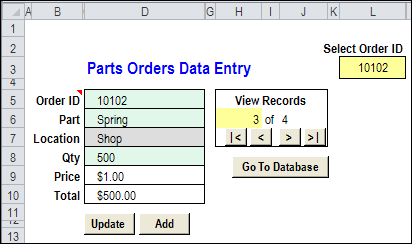
In the screen shot below, you can see an example.
Excel UserForm
Or, do you prefer to build an Excel UserForm?
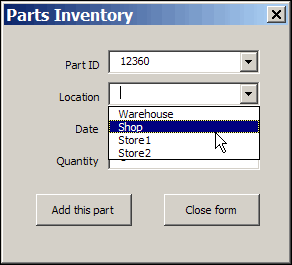
In the screen shot below, you can see a simple UserForm.
Worksheet Data Entry
With the worksheet method, you can
- hide the data sheets, and protect the data entry sheets, so users can only enter data in the unlocked cells.
- add a few navigation and function buttons, to help users with basic Excel skills.
An advantage is that you’re using built-in Excel features, like data validation and formulas, so you can reduce the development time.
Excel UserForm
The UserForm method takes longer to develop, because you’re adding another layer to the project. Advantages to this method include:
- combo boxes, which can be formatted, and have autocomplete (unlike data validation drop downs)
- tab order control, which isn’t available on the worksheet, where pressing the Tab key simply takes you to the next unlocked cell.
Which Would You Pick?
Both methods work well, and can be customized to be user-friendly and fool-resistant (nothing in Excel is fool-proof!) Programming would be required in both versions, to help with navigation, and to move data to the storage worksheets.
- The worksheet method is quicker and easier to create and maintain, and a project might take 4-5 hours to complete.
- The UserForm method is more sophisticated, and takes longer to build and maintain. The UserForm version of the same project might take 8-10 hours.
Which method would you use?
____________
Customize Excel Conditional Formatting Icons
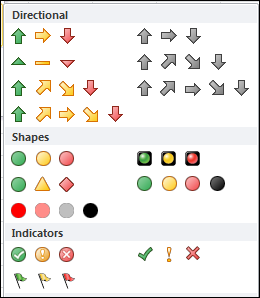
In Excel 2007 and Excel 2010, you can use icon sets in conditional formatting. There are built-in icon sets, and in Excel 2010 you can Customize Excel Conditional Formatting Icons, to some extent. Here’s how to do that, and a workaround to create icons on the worksheet instead.
Continue reading “Customize Excel Conditional Formatting Icons”
Excel Data Validation Fails
 Data validation is one of the best features in Excel. You can use it to create drop down lists, or limit what users can enter in a cell.
Unfortunately, data validation isn’t perfect, or foolproof. Users can get around the limits, by pasting data into the cell, or by using the Clear All command in a data validation cell.
Data Validation Input Errors
Someone sent me a question this week, asking how to trap input errors, despite these data validation failings:
- Hello! I was wondering, to you have any idea how to error trap a date input? I will enter dates on a specific column (complete dates such as 11/05/2010) and error trap if the input has the year of 2011 and not 2010. I know data validation does that, but only if the cell is manually inputted. If the input in the cell is pasted, it does not do that anymore.
Add the Data Validation
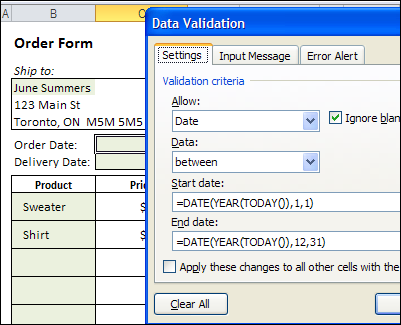
In this example, an order form has two cells for dates – an Order Date, and a Delivery Date. To ensure that a date for the current year is entered, you can use formulas in the data validation, to set a minimum and a maximum date.
Start Date formula: =DATE(YEAR(TODAY()),1,1)
End Date formula: =DATE(YEAR(TODAY()),12,31)
Check the Date
If you’re concerned that users might paste values into the cell, or clear the data validation, you can add a formula check, to ensure that a valid date was entered.
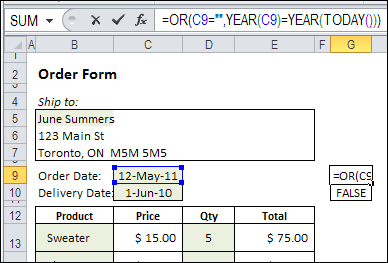
In the order form, a date check formula is entered in column G, which can be hidden.
The formula in cell G9 is:
=OR(C9=””,YEAR(C9)=YEAR(TODAY()))
The formula is copied down to cell G10, and the result is FALSE, because the date in C10 is not in the current year.
Block the Invoice Total
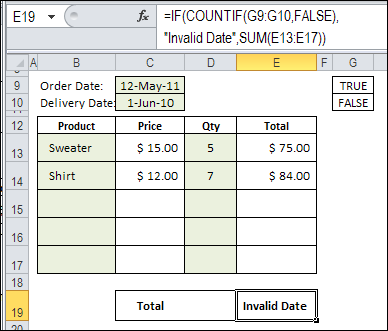
In the Invoice total cell, the formula result is “Invalid Date”, if either of the date check cells contains FALSE. If both dates are in the current year, the total sum is shown.
Here is the formula from the Invoice Total cell:
=IF(COUNTIF(G9:G10,FALSE),”Invalid Date”,SUM(E13:E17))
Other Solutions
Instead of a formula check, there are other ways to ensure that users enter valid data.
For example, you could use Excel VBA to check specific cells before printing, and cancel the printing if the entries aren’t valid.
Have you used other methods to ensure that users don’t ignore your data validation cells?
____________
Simple Project Planning With Excel Gantt Chart
If you’re building a new city, or plotting world domination, you’ll need a powerful project management tool, such as Microsoft Project.
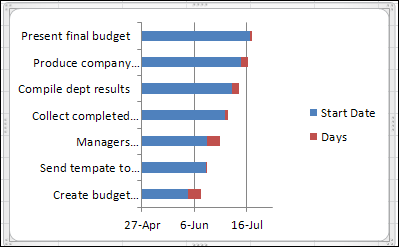
For smaller projects, you can list your tasks in Excel, and create a Gantt chart, to show the timeline. Here’s how you can do simple project planning with Excel Gantt chart – watch the video and there are written steps too.
Continue reading “Simple Project Planning With Excel Gantt Chart”
Fix Combo Box Sizing in Excel 2010
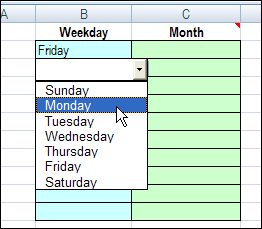
With Excel data validation, you can create drop down lists on a worksheet. However, the font size is very small, and can’t be adjusted, and you can only see 8 items at at time.
ComboBox on Worksheet
With Excel VBA programming, you can add a ComboBox to the worksheet, to show the data validation list.
In the ComboBox, you can control the font size and the number of visible items in the list.
Problems in Excel 2010
Although this technique works nicely in Excel 2007, and earlier versions, you might have a problem with the ComboBox size in Excel 2010.
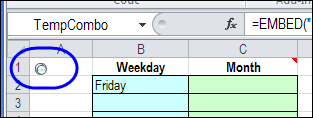
In the screen shot below, the ComboBox is about 1/4″ wide, instead of filling the entire cell.
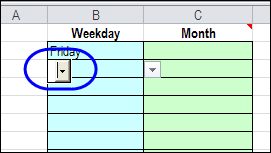
In other workbooks, the ComboBox is so narrow that you can’t see it at all. That’s not too helpful a feature!
Fix the Problem in Excel 2010
Fortunately, the problem is easy to fix in Excel 2010, if you follow these steps.
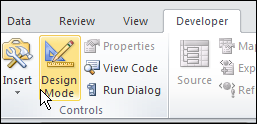
On the Developer tab, click the Design Mode command.
To select the ComboBox, type its name in the Name Box, and press Enter
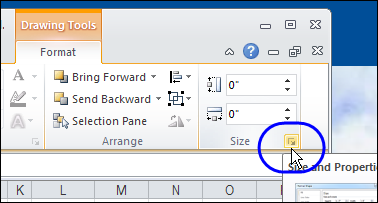
On the Ribbon, under Drawing Tools, click Format, and click the Dialog Launcher for the Size group.
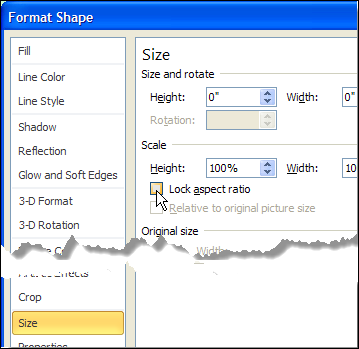
Format Shape Dialog Box
In the Format Shape dialog box, in the Size category, remove the check mark for Lock Aspect Ratio, and click OK
That should fix the ComboBox sizing problem!
Watch the Combo Box Sizing Video
To see the steps for changing the Size setting in Excel 2010, you can watch this short Excel video tutorial.
___________
Fuzzy Lookup Add-in for Excel 2010
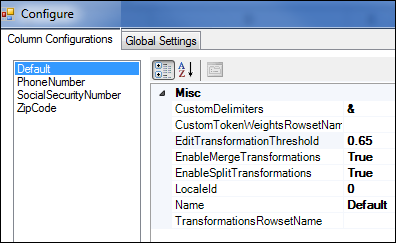
If you work with data in Excel, you know what a mess it can be. I help my customers clean up data that they’ve imported from another computer system, or from reports received from another department or group.
Those files can be filled with spelling mistakes, strange abbreviations, extra spaces or missing punctuation.
Macro to Move Pivot Table Slicer
 Recently, we saw how you can use Excel Slicers, to filter fields in one or more pivot tables. This week, we’ll use a macro to move a pivot table slicer.
Overlapping Slicers
In the comments of the previous article, James asked how to keep those Slicers from overlapping the pivot tables.
- Does anyone know how to stop slicers moving around when you make selections. This happens if the slicers are viewed on top of the pivot table data. As the pivot output data shrinks or expands the slicers move around and sometimes obscure each other. Any idea how to fix in place?
Pivot Table Update Event
One way to fix the problem of sliding Slicers is to automatically move the Slicers, any time the pivot table is updated.
To do that, you can use the PivotTableUpdate event, and a macro that moves the Slicer to the right side of the pivot table.
Slicer Caption
Each Slicer has a caption, and you can refer the the Slicer by that caption in the Excel VBA code.
In this example, the Slicer has a caption of “Region”, which is shown at the top of the Slicer.
The caption is also visible on the Excel Ribbon’s Options tab, when the Slicer is selected.

Macro to Move a Pivot Table Slicer
Here is the sample code that I used.
This macro moves a pivot table slicer to the right side of the pivot table, any time the pivot table is updated.
Note: This code is stored on a regular code module.
Sub MoveSlicer()
    Dim wsPT As Worksheet
    Dim pt As PivotTable
    Dim sh As Shape
    Dim rngSh As Range
    Dim lColPT As Long
    Dim lCol As Long
    Dim lPad As Long
    Set wsPT = Worksheets("PivotSales")
    Set pt = wsPT.PivotTables("PivotDate")
    Set sh = wsPT.Shapes("Region")
    lPad = 10
    lColPT = pt.TableRange2.Columns.Count
    lCol = pt.TableRange2.Columns(lColPT).Column
    Set rngSh = wsPT.Cells(1, lCol + 1)
    sh.Left = rngSh.Left + lPad
End Sub
How the Code Works
In the code, a variable (pt) is set for the pivot table.
The code counts the columns in the pivot table’s TableRange2 range, which includes the Report Filters area. (TableRange1 does not include the report filters.)
- lColPT = pt.TableRange2.Columns.Count
The code adds 1 to the column number that the last pivot table column is in.
- Set rngSh = wsPT.Cells(1, lCol + 1)
A variable (lPad) sets the padding number — how much the Slicer will be moved to the right. In this example, the variable is set to 10
- lPad = 10
Finally, the Slicer is positioned, in the column to the right of the pivot table. In that column, the Slicer’s left side is indented by the padding amount.
- sh.Left = rngSh.Left + lPad
Pivot Table Update Code
The following code should be copied to the pivot table’s worksheet module.
It will run the macro to move a pivot table slicer (MoveSlicer), any time the PivotDate pivot table is updated.
Private Sub Worksheet_PivotTableUpdate(ByVal Target As PivotTable)
    If Target.Name = "PivotDate" Then
        MoveSlicer
    End If
End Sub
Download the Sample File
To see how the macro to move a pivot table slicer works, you can download the Excel Slicer Move Code sample workbook. The file is in xlsm format, and is zipped. You’ll have to enable macros, to test the code.
_______