You might have heard a thing or two about March Madness, even in you don’t live in the USA, and follow college basketball. David Ringstrom explains how to use Excel to manage March Madness.

Contextures Posts
Here’s what I posted last week:
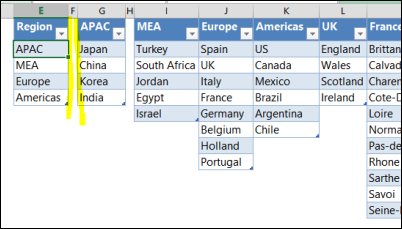
- Change the address of a named range, or create a dynamic range, so new items appear in drop down lists.
- Format a new pivot table in Classic Excel 2003 style, if you prefer the plain look, and drag and drop features from that version.
- Clear the data entry cells on a worksheet, without touching the formula cells.
- Finally, for a humorous peek at what other people are saying about Excel, read this week’s collection of Excel tweets, on my Excel Theatre blog.
Other Excel Articles
Here are a few of the Excel articles that I read last week, that you might find useful:
- Jan Karel Pieterse has updated the Startup Problems page on his site, to include the new tool from Microsoft – Office Configuration Analyzer Tool (OffCAT)
- Jon Peltier explains how to create a Dot Plot chart in Excel. If you make this type of chart frequently, or other complicated chart types, Jon’s Chart Utility will save you time and aggravation.
- The IT Portal shares 14 tips for intermediate Excel users. Do you know all of these? Good thing they saved those pie charts for the last tip, or I might not have made it to the end of the article
- If you’re an Excel power user, you already know the 11 Excel tricks that PC World posted.
- At the Daily Dose of Excel, Dick Kusleika used code that kept track of the keyboard shortcuts that he uses. You can copy his sample code, to see how it works.
Excel Resources
Here are some upcoming events, courses and new books, related to Excel.
- Registration is open for the Amsterdam Excel Summit. The one-day event runs on May 14, 2014, and features sessions by several Excel MVPs, such as Bill Jelen (Mr. Excel), Ken Puls and Charles Williams. All the sessions are in English, and the limit is 100 participants, so sign up now, if you’re interested.
What Did You Read or Write?
If you read or wrote any other interesting Excel articles recently, that you’d like to share, please add a comment below, or send me an email.
Please include a brief description, and a link to the article.
__________________________________
 Happy St. Patrick’s Day! Four years ago, we celebrated by

 Do you ever use the Watch window, to keep an eye on the results in one cell, while changing the data in another part of the workbook?