
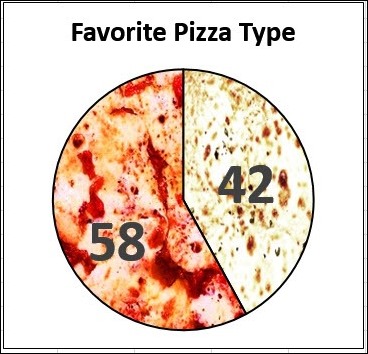
While flipping through a magazine on the weekend, I saw this pizza pie chart. Yes, the pizza looks delicious, but the toppings are split down the middle. That makes the vote appear to be 50-50, not 58-42. Fun idea, but bad pizza pie chart!
Author: Debra Dalgleish
Excel Roundup 20140414
Mike Alexander is having a contest on his Bacon Bits blog – create an Excel meme, and you have a chance to win a couple of Mike’s books. The deadline is April 16th, and the rules are on Mike’s blog.
If you aren’t sure what a meme is, Wikipedia describes it as an idea or picture that is shared on the internet. Mike posted a couple of examples on his blog, and here is my contribution. I’m sure you’ve met someone like this guy!
I made this in Excel, using the Insert Online Pictures command, and the text in WordArt. What can you come up with?

Center Headings Without Merging Cells
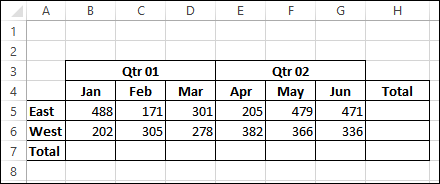
You know that merged cells are evil, and should be avoided at any cost. Those merged cells can make it almost impossible to do simple tasks on a worksheet, such as sorting or filtering. Merged cells can even make it difficult to select a range of cells – and that’s annoying, as you probably know! Here’s how you can center headings without merging cells.
Change Characters to Superscript
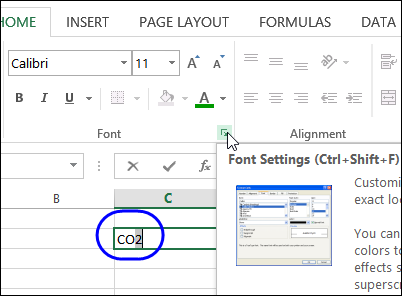
Do you ever use the Subscript or Superscript fonts formats in Excel? Maybe you’re reporting on chemical usage, and you need to enter CO2 as one of the row headings. Here’s how to change characters to Superscript – you could use similar steps to change characters to Subscript.
Excel Roundup 20140407
Last Friday, Microsoft’s Excel team hosted an AMA on Reddit, where anyone could submit a question about Excel. You can read all the questions and replies at this link.
It looks like the event went very well, so they might host another one sometime in the future. What would you ask the Excel team, if you had the chance? Think of your questions now, so you’ll be ready for the next opportunity.
Here’s one of the questions, and an answer by program manager, Ben Rampson:
Q: Do you guys ever see a use for Excel that you didnt even think was possible. Crazy forumals, etc
A: I’ve seen lots of crazy uses of Excel that I never expected. Some of my favorites:
- A customer issue escalation from NASA complaining the space shuttle launch would be delayed by a few months if we didn’t address the problem they found.
- A customer escalation from military with a business justification that was basically “innocent people will die” because of shapes being shifted over a few pixels in a spreadsheet.
- A manufacturing company that used Excel to run robots responsible for testing the electronics they were building on a manufacturing line. The amount of code they had written around their spreadsheet shocked me.

Contextures Posts
Here’s what I posted last week:
- Here’s how I cleaned an imported list in Excel, and split one column of data into 2 columns. There are other suggestions in the comments too.
- Can you send out a pivot table and prevent people from seeing all the source data? It’s not an easy task, but there are a few options that you can try.
- You can add headers to a combo box drop down list, so the columns are easier to understand.
- Finally, for a humorous peek at what other people are saying about Excel, read this week’s collection of Excel tweets, on my Excel Theatre blog.
Other Excel Articles
Here are a few of the Excel articles that I read last week, that you might find useful:
- You can’t use ActiveX controls on a Macintosh, so Prof. Lee Townsend shows how to create dependent drop downs using Form control combo boxes.
- And speaking of the Mac, one of the earliest spreadsheets was Trapeze. Its creator, Andrew Wulf, has decided to build a simple version of Trapeze from scratch for the iPad.
- Doug Glancy found that the SheetActivate event isn’t triggered if a workbook has multiple windows, so he added a workaround.
- I don’t want to be overly optimistic, but it looks like winter is finally over. At Neoformix, Jeff Clark used the weather data to show that winter in the Toronto area was the coldest in 20 years. You could download data for your area, and make a similar report in Excel.
- Scott Lyerly discovered that you can use VBA with the Ribbon in Microsoft Project, so why can’t you do something similar in Excel?
- How much money will you need to retire? The Blunt Bean Counter shares a retirement planning spreadsheet, and there a couple of other links in the comments.
Excel Resources
Here are some upcoming events, courses and new books, related to Excel.
- Registration is open for the Amsterdam Excel Summit. The one-day event runs on May 14, 2014, and features sessions by several Excel MVPs, such as Bill Jelen (Mr. Excel), Ken Puls and Charles Williams. All the sessions are in English, and the limit is 100 participants, so sign up now, if you’re interested.
- The European Spreadsheet Risks Interest Group – EuSpRIG –has announced the preliminary program for Eursprig 2014. This event will be held in Delft (Netherlands) on July 3, 2104.
Excel Dashboards and Reports for Dummies, by Mike Alexander.
336 pages, published March 31, 2014
Learn to: Analyze data and report it in a way that makes sense; slice and dice data from different perspectives; create eye-catching and understandable reports, visualizations, and dashboards; automate redundant reporting
Dashboarding and Reporting with Power Pivot and Excel, by Kasper de Jonge.
195 pages, published April 1, 2014
This book, written by a member of Microsoft’s Power Pivot team, provides a practical step by step guide on creating a financial dashboard. The book covers in detail how to combine and shape the relevant data, build the dashboard in Excel, providing layout and design tips and tricks, prepare the model to work with fiscal dates, and show values used in many financial reports.
What Did You Read or Write?
If you read or wrote any other interesting Excel articles recently, that you’d like to share, please add a comment below, or send me an email. Please include a brief description, and a link to the article.
[Update] Thanks for suggesting the following articles:
- Randy Rhea advises us to use a delimiter that’s not in the data, for easier imports.
- To help organize your data, Randy suggests using a macro that enters the date and user’s initials in a task list.
- Barb Darrow doesn’t think that Excel on the iPad is much use, if it doesn’t have macros.
_______________________________
Headers on Excel Combo Boxes
You can use combo boxes to show a drop down list, either in a UserForm, or on a worksheet. Sometimes a list is easy to understand, like this one, which shows a part number and part name.

If the list has multiple columns, it might help if there is a heading for each column, like the one in the next screen shot.

You could probably figure it out without the headings, but it removes any potential confusion, if you show the labels at the top of the list.
Continue reading “Headers on Excel Combo Boxes”
Change Single Column List to 2 Column Table
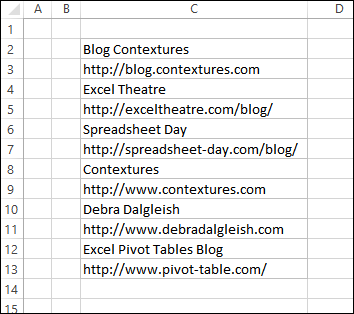
On the weekend, I copied a list of blog names and URLs into Excel. On the website that I copied it from, the list was in 2 columns, but it pasted into a single column in Excel. Having everything mixed together in one column wasn’t going to be very helpful. Here’s what I did to change single column list to 2 column table.
Continue reading “Change Single Column List to 2 Column Table”
Excel Roundup 20140331
Last week, three Office apps were released for the iPad – Excel, Word and Powerpoint. Have you downloaded any of the apps, and tried using them?
If you’re not sure whether to download them, you can read Ed Bott’s review of the new apps – he’s quite impressed by them. Bill Jelen (Mr. Excel) also reviewed the Excel app, and you can see his report here. Bill lists what’s in the apps, and what’s missing.
In the video below, there is a short interview with Han-Yi Shaw, head of Microsoft’s Office Design Studio. For more details, click here to read the Mashable interview.
Contextures Posts
Here’s what I posted last week:
- In one of my files, an image changed size after previewing the worksheet. No idea why it happened, but a simple tweak fixed the problem.
- You can create two types of formulas in a pivot table – calculated items and calculated fields. See what the differences are, and an example of how to use them.
- While working with pivot tables, I ran into the least informative error message that I’ve ever seen in Excel.
- Finally, for a humorous peek at what other people are saying about Excel, read this week’s collection of Excel tweets, on my Excel Theatre blog.
Other Excel Articles
Here are a few of the Excel articles that I read last week, that you might find useful:
- Jon Peltier shows how to make a specific chart label a different colour, using formulas, instead of programming.
- Sharepoint MVP, John White, warns not to update your Power Query structure after building your data model..
- Mynda Treacy shows how to plot missing dates in a pivot chart
- Chandoo challenged us to solve an Excel problem, and find the products with the maximum change in monthly sales. There were 170 comments, with a wide variety of solutions.
- If you’re a little rusty in statistics, Mike Alexander gives a clear explanation of standard deviation, and the options for calculating it in Excel
- Instead of March Madness basketball, David Ringstrom has a battle between your favourite Excel features and functions. It’s down to the Sweet 16 now, so which ones will you vote for?
Excel Resources
Here are some upcoming events, courses and new books, related to Excel.
- Registration is open for the Amsterdam Excel Summit. The one-day event runs on May 14, 2014, and features sessions by several Excel MVPs, such as Bill Jelen (Mr. Excel), Ken Puls and Charles Williams. All the sessions are in English, and the limit is 100 participants, so sign up now, if you’re interested.
What Did You Read or Write?
If you read or wrote any other interesting Excel articles recently, that you’d like to share, please add a comment below, or send me an email.
Please include a brief description, and a link to the article.
__________________________________
Screenshot – Excel for iPad

Least Informative Excel Message Ever
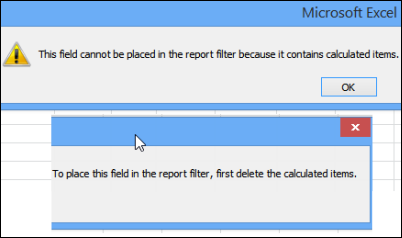
I’ve seen some confusing Error messages while working in Excel, and some rather cryptic ones. But yesterday, I saw the least informative Excel message ever, while working with a pivot table in Excel 2013.
Continue reading “Least Informative Excel Message Ever”
Excel Images Change Size After Preview
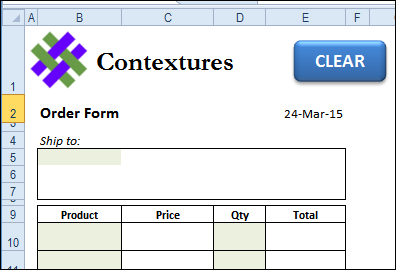
I ran into an odd problem with images in Excel 2010 last week – after looking at the sheet in Preview, a small logo graphic grew big enough to cover the most of the data on the sheet! Have you run into the problem where Excel images change size after Preview?