
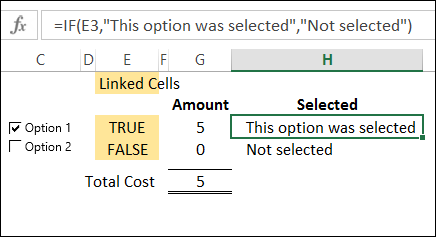
To make it easy for people to enter data on a worksheet, you can insert a check box control, using the Form Control tools on the Developer Tab. Then, use check box result in Excel formula solutions.
Author: Debra Dalgleish
Create Excel Table With Specific Style
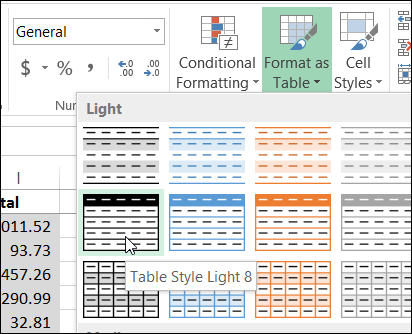
When you create a named Excel table with the Table command on the Ribbon’s Insert tab, the table retains any formatting that it currently has, and the default Table Style is applied.
Excel Crashing After Combo Box Click
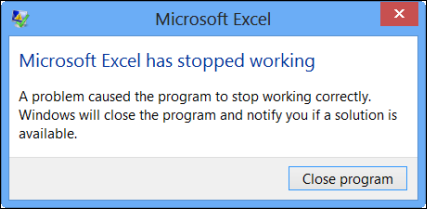
Last week, I was updating my web page that shows how to show a combo box in a cell that has a drop down list. Here’s a screen shot of that workbook.
Dependent Drop Down Lists in Excel
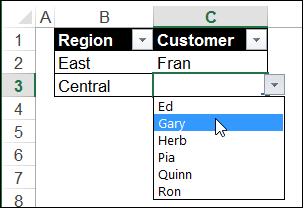
In Excel, you can set up drop down lists that are dependent on the selection made in another cell. In this example, you select a region in column B, and only the customers in that region are in the dependent drop down list in column C.
Calculate Loan Payments with PMT Function
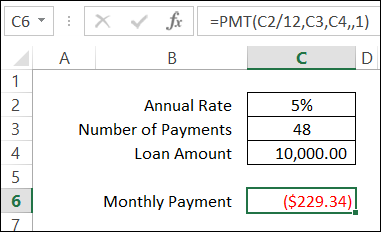
Even if you’re not a financial wizard, you’ve probably had to figure out a loan payment at least once in your life. Fortunately, Excel makes it easy to calculate loan payments, with the PMT function.
Continue reading “Calculate Loan Payments with PMT Function”
Getting Started With Excel UserForms
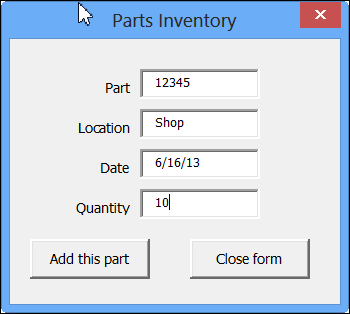
With some VBA programming, you can create an Excel UserForm, to use for data entry. Click a button, and the data is stored on a hidden worksheet, and the form is cleared out, so you can start a new entry.
If you’re just getting started with Excel UserForms, the short video below shows how a completed form works.
Update Multiple Pivot Tables 20130618
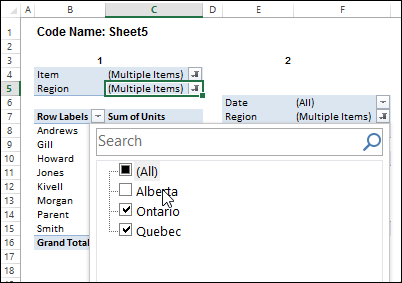
In the screen shot below, one of the report filters in a pivot table is about to be changed. If you have multiple pivot tables in a workbook, you can use programming to update all (or some) of the pivot tables, if one pivot table’s filters are changed.
Excel Functions: AVERAGE, MEDIAN, MODE
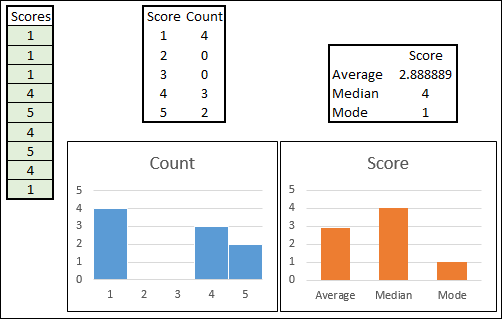
When we created a Box Plot recently, one of the measures was the MEDIAN. Today we’ll look at a few Excel Functions: AVERAGE, MEDIAN, MODE
Create a Simple Box Plot in Excel

A box plot (box and whisker chart) lets you show how numbers are distributed in a set of data. Excel doesn’t have a built-in chart type for a box plot, but you can create a simple box plot in Excel, using a stacked column chart, and error bars.
Interactive Excel Functions List
There are lots of Excel function tips and tutorials on my Contextures website, and here on the Contextures blog.
To help me keep track of everything, I’ve created an interactive list of the Excel functions, that you can see here: Interactive Excel Functions List

Sort and Filter
On the web page, you can click the green button to open the interactive version of the list. Then, click on a heading to sort the list by that column, such as Category or Version Added.
To filter, click on a column name at the left, and select one of the items to filter. For example, in the screen shot above, the list is filtered to show the functions that were added in Excel 2010.
Click a Link
Some of the function names are hyperlinks – click those to go to my web page or blog post with an example for that function.
For example, click the AGGREGATE link, to see the examples for this versatile new function in Excel 2010.
I’ll be adding more function examples over the coming months, and will update this list to include the new links.
Video Tutorials
I’ve also updated the Video Tutorials Index page. In addition to the video links, I’ve added video playlists, so you can see all the videos in a specific category, such as Data Validation.
In the sample playlist below – Excel Functions — click the “Playlist” list at the bottom left of the video screen. You should see a scrollable list of videos in that category, and click on any video to start the playlist.
There are currently 73 videos in this playlist, and the total time is 3 hours and 51 minutes.
_____________