
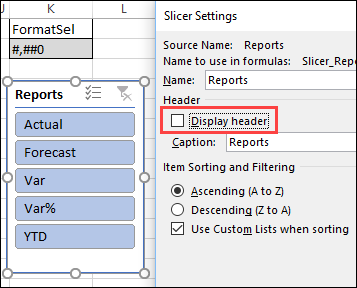
Instead of showing a budget’s forecast, actual and variance data all at once, click a button to view the values one at a time. That makes the report easier to read, and takes less space on the worksheet. See how this technique works in my Budget Reporter with value selector workbook.
Category: Pivot Table
Problem Grouping Pivot Table Items
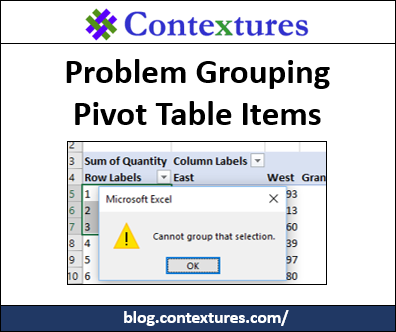
If you try to group pivot table items in Excel, you might get an error message that says, “Cannot group that selection.” For older versions of Excel, if you had a problem grouping pivot table items, it was usually caused by blank cells, or text in number/date fields. For Excel 2013 and later, there’s another thing that can prevent you from grouping — the Excel Data Model.
Scroll Through Filter Items in Excel Table
To see specific data in an Excel Table, you can select an item from the drop down filter in a column heading. Someone asked me if there was a way to scroll through the items, instead of opening the filter list each time. This technique uses a pivot table, which could be hidden on a different sheet, and a spin button, to go up or down in the list of items.
Continue reading “Scroll Through Filter Items in Excel Table”
Quick Trick to Add or Move Pivot Table Fields
We’re still recovering from Tuesday’s Spreadsheet Day celebrations, so we’ll keep it simple today. Here’s a quick trick to add or move pivot table fields, just by typing. Watch the really short video, and there are written instructions below, if you prefer those.
Continue reading “Quick Trick to Add or Move Pivot Table Fields”
Multiple Copies of Pivot Table Sheet
If you need to make a quick report, Excel has a built-in command that makes multiple copies of a pivot table – one for each item in a Report Filter. See how that feature works, its limitations, and a macro that will copy the entire sheet, not just the pivot table.
Compare Pivot Table Values As Percentages
As you know, pivot tables are a quick and easy way to summarize a huge table of data in Excel. With just a few clicks, you can create totals for thousands of rows of data, without writing a single formula. Then, with filters and Slicers, zero in on specific parts of the data. But there’s an underused feature that you might be missing – do you know how to compare pivot table values as percentages?
Continue reading “Compare Pivot Table Values As Percentages”
Compare Weekdays in Fiscal Year Summary
In the retail businesses, some days of the week are busier than others. So, if you’re looking at year over year sales, it’s not too helpful to compare sales for a specific calendar date, because they’ll fall on different weekdays. With a few calculations, you can set up a summary that lines up the weekdays, so you can get a better comparison.
Pivot Table Fill Colour Disappears
Microsoft just announced the winner of their Excel World Champ data visualization contest. Congratulations to Ghazanfar Abidi, from Canada! I found his website today, and learned something new from his latest blog post – depending on how you apply it, pivot table fill colour might disappear!
Pivot Table Subtotal Problem in Excel 2016
If you using grouping, you might run into a pivot table subtotal problem in Excel 2016. There was a change in a recent update, so you might see this problem if you have an Office 365 subscription. I just learned about this issue, and will show you how to fix the problem if it affects your workbooks.
Continue reading “Pivot Table Subtotal Problem in Excel 2016”
Remove Excel Pivot Fields With Macros
If you’re rearranging a complex pivot table, it can take a while to manually remove each field. To make the job easier, you can remove Excel pivot fields with macros. There’s a sample macro below that remove all the column fields, and you’ll find more examples, and a free workbook, on my website.