In the retail businesses, some days of the week are busier than others. So, if you’re looking at year over year sales, it’s not too helpful to compare sales for a specific calendar date, because they’ll fall on different weekdays. With a few calculations, you can set up a summary that lines up the weekdays, so you can get a better comparison.
Comparing Calendar Dates
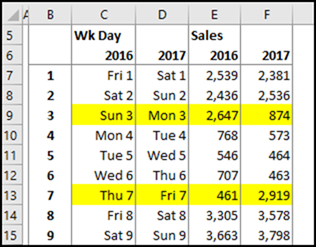
Here’s an example of what happens when you compare a store’s sales based on calendar dates. The sales on April 3rd are much higher in 2016, because it fell on a Sunday, when the stores were busy. For 2017, April 3rd was on a Monday, when sales are usually slow.
Comparing Weekdays
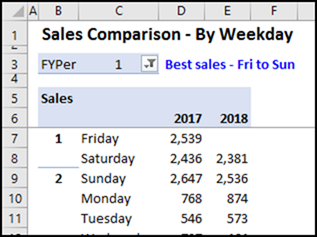
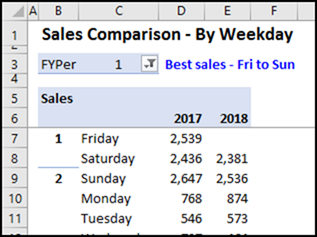
To get a better comparison, a Weekday field was added to the source data. With that field in the pivot table, you can compare the first Saturday in each fiscal year.
That makes it easier to see that the sales are down a bit in April 2017, which is the start of Fiscal Year 2018 in this example.
Add a Weekday Field
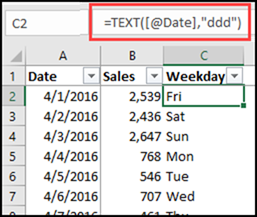
To make this comparison possible, a Weekday field was added to the sales data. It uses a simple TEXT formula to get the 3-letter code for each date’s weekday.
=TEXT([@Date],”ddd”)
Calculate Fiscal Year Start Week
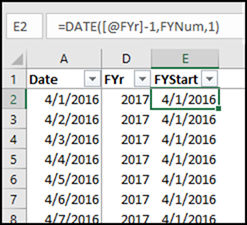
More formulas were added to the sales data, and you can see all of them on the Fiscal Year Weekdays page on my Contextures website.
To line up all the weekdays correctly, the Fiscal Year and FY Start Date are also calculated.
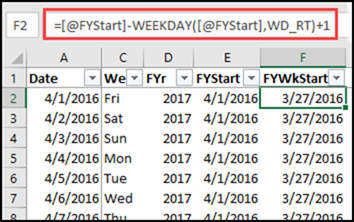
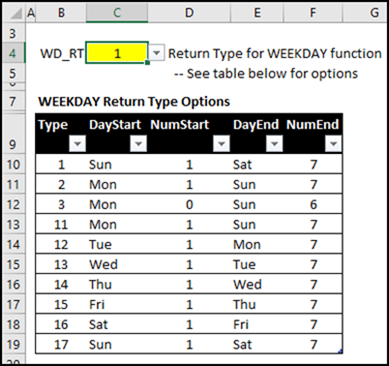
Then, the Sunday of the FY Start Date’s week is calculated. The formula uses the WEEKDAY function, and there is a named cell, WD_RT, where you can select the return type for that function.
In this example, return type 1 was used, so Sunday is day and Saturday is weekday 7.
Compare in a Pivot Table
After all the Fiscal Year calculations have been added to the sales data table, you can build a pivot table to summarize the data, and compare year over year.
- Fiscal Period was also calculated, and used in the Report Filter area.
- Fiscal Week and Weekday are in the Row area
- Fiscal Year is in the Column area
- Sales Amount is in the Values area
Download the Sample File
To see all the formulas and the pivot table, go to the Fiscal Year Weekdays page on my Contextures website. In the download section, click the link to get the file. The zipped workbook is in xlsx format, and does not contain macros.
___________________


