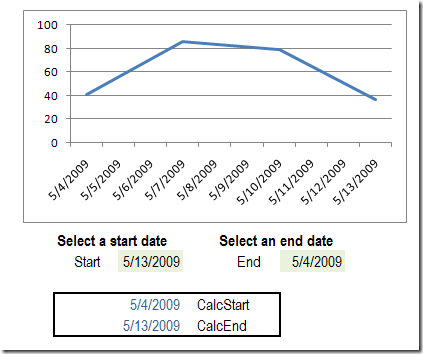
Recently, I wrote about creating dynamic charts in Excel, where you can select a date range from drop down lists. In that article I warned that the dynamic values would disappear if the entire range is selected, in Excel 2007.
I’ve done more testing, to see when the values stick, and when they disappear, and there’s a new version of the file for you.
Excel 2007 Tests
First, I tested Excel 2007, with and without an Excel Table, and using different formulas for the named ChartDates range.
| Table | Dyn Lost | ChartDates Range |
| Yes | Yes | =Table1[Date] |
| Yes | Yes | =OFFSET(Chart!$A$1,1,0, COUNT(Chart!$A:$A),1) |
| Yes | Yes | =Chart!$A$2:$A$23 |
| No | No | =OFFSET(Chart!$A$1,1,0, COUNT(Chart!$A:$A),1) |
| No | No | =Chart!$A$2:$A$23 |
With the data in an Excel Table, the dynamic chart values were always lost, if the full date range was selected.
So, the best option in Excel 2007 is to avoid an Excel Table, and use a dynamic ChartDates range.
Excel 2003 Tests
I hadn’t noticed the problem of disappearing dynamic values in earlier versions of Excel, so I tested the Lists feature in Excel 2003. Here are the test results:
| List | Dyn Lost | ChartDates Range |
| Yes | Sometimes* | =OFFSET(Chart!$A$1,1,0, COUNT(Chart!$A:$A),1) |
| Yes | Sometimes* | =Chart!$A$2:$A$23 |
| No | No | =OFFSET(Chart!$A$1,1,0, COUNT(Chart!$A:$A),1) |
| No | No | =Chart!$A$2:$A$23 |
*If the entire range is shown in the chart, and you add a new item at the end of the chart data, dynamic values in the chart are lost. However, you can select the entire range, without losing the dynamic values.
So, the best option in Excel 2003 is to avoid a List, and use a dynamic ChartDates range.
Control the Start and End Date Selection
In the creating dynamic charts in Excel post comments, Jeff Reese asked how you could ensure that the user selects an End Date that’s greater than the Start Date.
Michael Pierce suggested a dynamic range for each of the drop down lists.
- My suggestion would be to create named ranges for the Start and End Date, using the same offset technique as is used for XValues and YValues. The StartValues range would start at the beginning of the list and continue through the EndDate – 1. The EndValues range would begin at Start Date + 1 and continue through the end of the list. That way, the list of valid end dates is updated any time a selection is made for either date.
Derek suggested using the earlier date as the Start Date and the later date as the End Date:
- Alternatively, have the start date and end date be replaced in the formulae with MIN(start date, end date) and MAX(start date, end date), ensuring that whichever is the greater is used as the end date. I assume the graph would just look silly if the two dates were the same, not broken.
Calculate the Start and End Dates
Michael’s suggestion would work well, but users might have problems switching from an April date range to a May date range. The May end date would have to be selected first, to make the May start dates available.
I decided to go with Derek’s suggestion, and use the earlier date as the start date, whether it’s in the Start Date cell, or the End Date cell.
The CalcStart formula:
=IF(StartDate=0,MIN(ChartDates),MIN(StartDate,EndDate))
The CalcEnd formula:
=IF(EndDate=0,MAX(ChartDates),MAX(StartDate,EndDate))

Name the Cells
I named the date calculation cells as CalcStart and CalcEnd, and used those names in the XValues definition:
=OFFSET(Chart!$A$2,MATCH(CalcStart,ChartDates,0)-1,0,
MATCH(CalcEnd,ChartDates,0)-MATCH(CalcStart,ChartDates,0)+1,1)
Download the Revised Sample File
You can download the revised Excel 2007 sample file for Dynamic Date Range Charts. In it, the Excel Table has been removed, and the start and end date calculations added.
NOTE: The Instruction sheet was not changed – ignore the steps that tell you to create a formatted Excel table.
_____________________

Good catch on my suggestion! I was only thinking about the first date selection, not subsequent ones. The selected approach will work more reliably.
Thanks Michael, your suggestion for the dynamic list was good, and got me thinking.
RE: Dynamic Charts and “=OFFSET(Chart!$A$1,1,0,COUNTA(Chart!$A:$A),1)”
When I replace the “COUNTA(Chart!$A:$A)” parameter with a function call, the dynamic charting updates stop working. The charts only update when the workbook is saved. Any idea what causes this to occur?
Thanks