
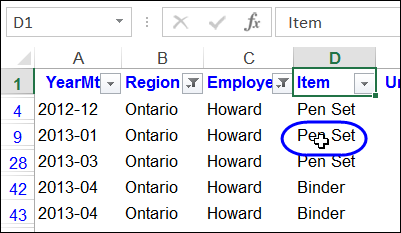
Here is a fancy filter trick, if you frequently have to filter your Excel tables. Click on a cell in this Excel table, and the column is automatically filtered for that item. In the worksheet shown below, columns B and C have already been filtered, and when I click on Pen Set, column D will only show that item.
Author: Debra Dalgleish
Dashboard Tools Add-In Giveaway Winners
Last week, Mike Alexander, from Bacon Bits Blog, provided 2 copies of his time-saving new Dashboard Tools add-in for our Excel giveaway. Here are the dashboard tools add-in giveaway winners.
NOTE: The Bacon Bits Blog is no longer online.
Block Duplicate Entries in Excel Table
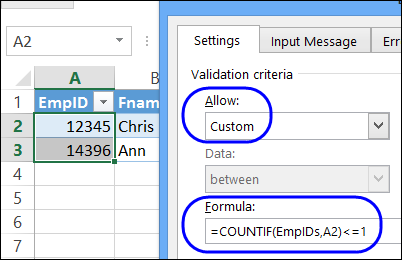
Data validation is a great feature in Excel, and I often use it to create a drop down list in a cell. That helps prevent data entry errors, and limits what people can input. You can use data validation rules in other ways too. For example, you can block duplicate entries in Excel table columns, or in a range of cells.
Excel Dashboard Tools Add-in Giveaway
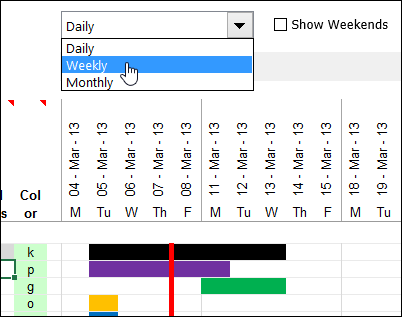
Last week, Jon Wittwer, from Vertex42, provided 4 copies of his awesome Gantt Chart Template Pro, for project tracking. The lucky winners, in my random Excel draw, are:
- John A Robinson, with comment 23
- Neil R, with comment 12
- jimmm, with comment 7
- Beth, with comment 19
Congratulations! I’ll email you later today, to arrange sending you a copy of the template kit. And thanks Jon, for providing the prizes!
Dashboard Building
A couple of weeks ago, during the hot days of August, we had a giveaway for an Excel Reports & Dashboards book, by Mike Alexander and John Walkenbach. You made great comments on that topic, and mentioned that you’re trying to find ways to build better dashboards.
There were 58 entries, with 17 people saying “No”, they haven’t built a dashboard in Excel, and 41 “Yes” votes.

Dashboard Layout Problems
From your comments, I broke down the problems into broad categories, and layout was by far the biggest source of problems. Among the “Yes” votes, there were 25 mentions of layout issues – 61% of those votes.
I’ve uploaded my summary file to the SkyDrive, and you can open it there, and download it to your computer if you want to play with the results. The interactive view is below, and you can go from there to the online file.
The Dashboard Tool
This week, to help you with planning and building your dashboards, the giveaway is Mike Alexander’s new Dashboard Tools add-in. He sent me a copy to try it out, and it’s great!
NOTE: The Dashboard Tools add-in is no longer available, and Mike’s website is not longer online
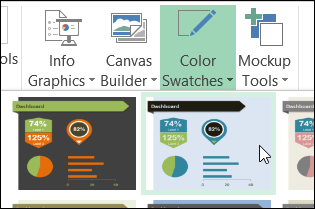
The add-in creates a new group on the Ribbon’s Insert tab. You can use the Mockup Tools to lay out the components during the planning phase.

Then, use the Info Graphics, Canvas Builder and Color Swatches tools to create a dashboard layout, and link it to your data.
There are lots of colours and shapes to choose from, so you can break out of your usual layout, and dazzle your co-workers, and boss, with something new.

In the screen shot below, I’ve added a pointer from the Info Graphics tab, and linked its textbox to the value in cell D2. A couple of clicks, and it was done.

Enter the Giveaway
Mike Alexander, from Bacon Bits Blog, has donated 2 copies of his Dashboard Tools add-in for this giveaway. If you’d like a chance to win a copy, please read the rules, and then make a comment below.
NOTE: If you’re reading this in email, or an RSS feed, please go to my blog to add your comment.
- In your comment, tell us a benefit you’d get from using Mike’s dashboard tools add-in
- Include your email address, so I can contact you if you win. Your contact information won’t be publicly visible, and it won’t be used for any other mailings.
- The deadline is Wednesday, September 11th, 2013, at 12 noon Eastern Daylight Time.
- One entry per person.
- The 2 winners will be announced on Thursday, September 12th, 2013.
- Each winner will have 24 hours to claim the prize, and if not claimed, another name will be selected.
___________________
Create Your Own Excel Icon Set
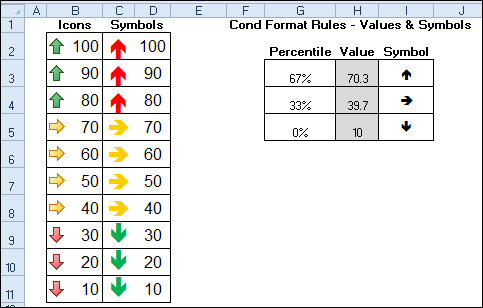
See how to create your own Excel icon set, to overcome a limitation with the built-in options. Icon Sets were added to conditional formatting in Excel 2007, and you can use the icons to highlight the results in a group of cells. This workaround uses symbols on the worksheet, instead of the Icon Set symbols.
Excel Gantt Chart Template Giveaway
Last week, we had a giveaway for Excel Dashboards and Reports, by Mike Alexander and John Walkenbach, and here are the winners:
Enter Multiple Items in an Excel Cell
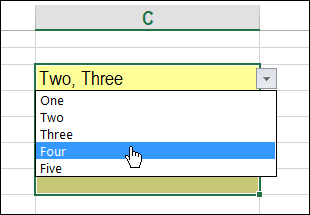
Today we’ll see an interesting tweak to an old technique. One of the articles on my website shows how you can select multiple items from a cell’s drop down list. Instead of overwriting the cell’s value, new selections are added to the end of the cell’s contents. Here’s how to enter multiple items in an Excel cell, if it doesn’t have a drop down list.
Excel Dashboards Book Giveaway
Last week, we had a giveaway for my PivotPower Premium add-in, and here are the winners:
- Heather R, with comment 5
- Jeff, with comment 26
Congratulations, and I will email you later today, to arrange sending your copy of the file.
Excel Dashboards & Reports
This week, Katie Mohr, from Wiley, has donated 2 e-book copies of Excel Dashboards and Reports, by Mike Alexander and John Walkenbach. If you are interested in building dashboards, this will help you get started, or increase the skills that you already have.
The book has excellent review on Amazon, and it takes you from the preliminary steps of planning the dashboard, to setting up the data, and creating interactive controls and even macros to enhance it.
It covers charts, sparklines and pivot tables, plus instructions for connecting to data outside of Excel.
Waffle Charts
One of the book’s chart examples is a Waffle Chart, also known as a Square Pie Chart. It’s a 10×10 grid, and the coloured squares represent the completed portion. To see the instructions, you can download a free pdf file from the Amazon site.
Mike says, “This kind of chart is a relatively effective option when you want to add an interesting visualization to your dashboard without distorting the data or taking up too much dashboard real estate.”

Enter the Giveaway
Katie Mohr, from Wiley, has donated 2 e-books for this giveaway. If you’d like a chance to win a copy, please read the rules, and then make a comment below.
- In your comment, tell us:
- If you have built an Excel dashboard, did you run into any problems?
- If you haven’t built an Excel dashboard, why would you like to get started?
- Include your email address, so I can contact you if you win. Your contact information won’t be publicly visible, and it won’t be used for any other mailings.
- The deadline is Wednesday, August 28th, 2013, at 12 noon Eastern Daylight Time.
- One entry per person.
- The 2 winners will be announced on Thursday, August 29nd, 2013.
- Each winner will have 24 hours to claim the prize, and if not claimed, another name will be selected.
___________________
Adjust Excel Column Widths to Fit Specific Cells
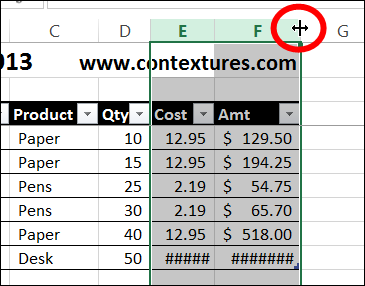
I have a quick tip for you today, that might make your worksheets look a little better. We’ll adjust column widths based on a specific cell.
Continue reading “Adjust Excel Column Widths to Fit Specific Cells”
Excel PivotPower Premium Giveaway
Last week, we had a giveaway for the new Excel Tips Workbook from Vertex42. Thanks to Jon Wittwer for donating the prizes, and here are the winners:
- Tim, with comment 5
- Ute-S, with comment 34
Congratulations, and I will email you later today, to arrange sending your copy of the file.
PivotPower Premium
We’ve been fortunate to have some great prizes for the summer giveaways, and I really appreciate the generosity of my Excel colleagues.
Now it’s my turn to provide the prizes. This week, you’ll have a chance to win a copy of my Excel add-in for working with pivot tables – PivotPower Premium (Ribbon Version). There will be 2 winners, so be sure to enter!
[Update: This product is no longer available]
The add-in is easy to install, and is designed for Excel 2007 and later (Windows only). One of its time-saving features is Set Defaults, which lets you store your favourite pivot table settings. Then, select any pivot table, click Apply Defaults, and all those settings are applied.

More Tools for Pivot Table Work
There are many more tools in the PivotPower Premium add-in, including number formats, and a button that changes all the fields to Sum. That’s handy when Excel decides that half of your fields should be “Count of”.

There are even a few tools for changing your workbook and worksheet settings, so your pivot tables can look their best. The screen shot below shows the Ribbon in Excel 2010, and the one above is in Excel 2013.

Enter the Giveaway
I’m picking 2 winners for this giveaway. If you’d like a chance to win a copy, please read the rules, and then make a comment below.
- In your comment, tell me one thing that you love about pivot tables, AND/OR one thing that pivot tables should do better.
- Include your email address, so I can contact you if you win. Your contact information won’t be publicly visible, and it won’t be used for any other mailings.
- The deadline is Wednesday, August 21st, 2013, at 12 noon Eastern Daylight Time.
- One entry per person.
- The 2 winners will be announced on Thursday, August 22nd, 2013.
- Each winner will have 24 hours to claim the prize, and if not claimed, another name will be selected.
__________________________