
Are you watching any of the 2022 Winter Olympics coverage? I hear the medal count reports on the morning radio, but that’s about all I’ve seen!
Back in 2010, the Winter Olympics were in Vancouver, Canada, so we watched lots of events that year. I downloaded some athlete bios that year, and had fun turning that data into pivot tables.
Winter Athlete Data
You can read my Winter Olympics blog post from February 2010, when I showed some of my pivot table reports and pivot charts.
The data had each athlete’s name, sport, country, age, weight and height. So, I made a pivot table with the maximum athlete age for each winter sport.
Then, I sorted the results in descending order by Age, to find the sports with the oldest competitors.
Would you have picked Alpine Skiing as having the event with the oldest participants?

Athlete Age by Country
Next, I made a pivot table with Country, maximum age and athlete count for each country.
There was only one athlete from Mexico, and it was that 51 year old alpine skier!

Age Range in Winter Sports
Next, I made a pivot table with the athlete counts per age, per sport, and built a pivot chart based on that.
To keep it simple, I filtered the sports, and only showed 4 sports in the chart – curling, figure skating, ice hockey and speed skating. Wen the Olympics are on, those are the sports I’m most likely to watch!
And, as you can see from the pivot chart, you can participate in curling at almost any age!

Athlete Sample Data in Excel
Back in 2010, the winter athlete same file was in text format. This year, I’ve put it into an Excel file (xlsx format, no macros), so it’s easier to work with.
Here’s a screen shot of the winter athlete data, nicely organized in an Excel table.
- There are 6 columns of data, with no calculations in the table.
- There are 2606 rows of data in the athletes table.
You can get the file on my Excel Sample Data page, along with several other sample data files.

Olympic Hockey Player Data
A few years ago, I did another Olympic athlete data analysis, using hockey teams from Canada and the USA.
That data had date of birth, instead of age, so I used a formula to calculate the ages.
I also had to convert the height to inches. In the data, it was entered as text, with a foot mark, such as 5’10

From that data, I created a few fancy pivot tables, like this one.
It compares the players from the Women’s hockey teams.

Player Hometown Map
For a final flourish, I made a map in Excel, showing the home towns for all the Canadian players.

Excel & Power BI Training
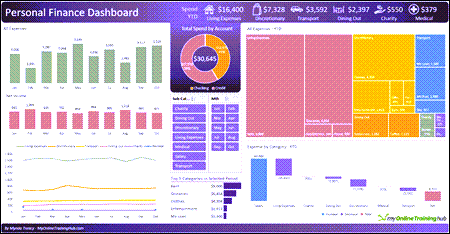
If you want to go beyond simple pivot tables and pivot charts, take a look at Mynda Treacy’s free Interactive Personal Finance Dashboard tutorial. There’s a step-by-step video, and you can download the sample workbook, to follow along. Mynda will show you some great tips for your own dashboards!
Mynda offers full courses too, and you can get 20% off, until next Thursday, Feb. 17th, for her Excel Dashboards and Power BI courses:
Get the Excel Sample Files
You can get both the 2010 Athlete data sample file, and the Hockey Player data sample file on my Contextures site.
Go to the Excel Sample Data page, to find them, and several other Excel sample files too!
_____________________________________
Excel With Olympic Athlete Data for Winter Fun

_____________________________________