Congratulations to the USA Women’s Hockey team, who won the Olympic gold medal. They beat our Canadian team, in a hard-fought game that went into overtime, and ended with a shootout. The team rosters were available online, so I used those for a hockey player data analysis, in Excel pivot tables. Is there anything in the player data that shows why the USA team won?
Team Canada Fans
Last week on Twitter, Science_Goddess and I were cheering for Team Canada. They had won the previous 4 gold medals, and seemed like a sure bet. Meanwhile, David Napoli was confident that Team USA would win this time.
We made a friendly wager, and the fans of the losing team promised to write a hockey data post, congratulating the winning team. So here I am, saying congratulations to Team USA!
Since I’m not a hockey expert, or a master statistician, I’ll leave the in-depth game analysis to someone else. Instead, here is my rudimentary player data analysis, based on the team rosters. And of course, I used my favourite Excel tool – pivot tables.
Team Rosters
The rosters have player names, height, date of birth, etc., but are set up slightly differently, so there was some cleanup work to do, before starting. If you’d like to do your own analysis, you can find the hockey team rosters here:
Team Canada Site
Team USA Site
Wikipedia
What Matters?
The team rosters don’t show skill rating, or past performance stats, or any other training data, so what could I use for player data analysis?
- What age range is represented in the hockey teams. Are there differences among the teams? Did a team with younger players do better?
- You’d expect the players to be in top physical condition, so what does the height and weight data show? Did the bigger team win, or is there an advantage to being smaller?
- Finally, are the players from a snowy region? Most of Canada gets snow and ice in winter, but what about the USA players? Are they all from the northern states?
Age Calculations
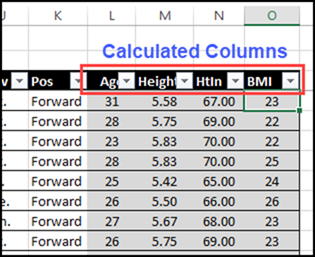
Before doing any player data analysis, a few calculations were needed in the rosters.
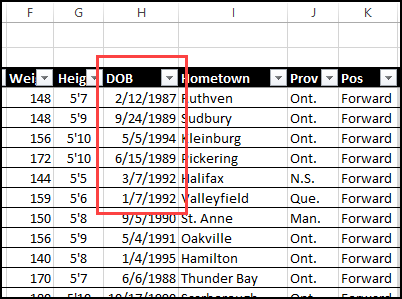
First, the rosters had each player’s date of birth, so what formula could you use to get each player’s age?
To calculate the ages, I used this DATEDIF formula, but be careful with that function – it can give incorrect results in some versions.
=DATEDIF([@DOB],TODAY(),”y”)
Player Height and Weight
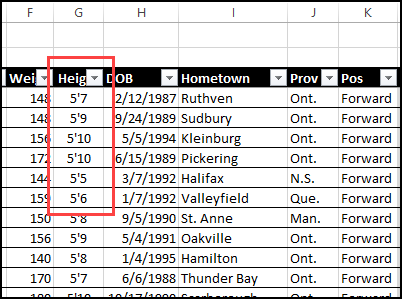
Next, I added a calculation to convert the height from a “text” feet and inches, such as 5’7, to separate cells with feet and inches
Here’s the column with the original text values for height, in feet and inches.
I also added a formula to calculate a BMI for each player, based on their height and weight measurements.
weight in pounds / [height in inches x height in inches] x 703
Summarize the Data
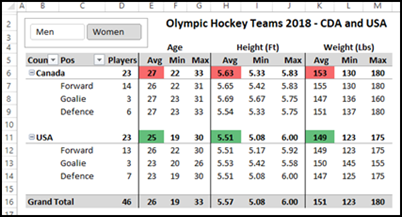
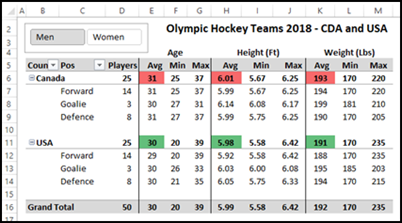
After the calculations were completed, I built pivot tables to show the player data analysis. The first table shows player counts, for each position, plus age, height and weight.
In the pivot table, the age, height and weight are shown using 3 different summary functions – Average, Minimum, and Maximum. After you add the value, right-click on one of the numbers, click Summarize Values by, and choose one of the functions.
In the country subtotal row, conditional formatting highlights the higher amounts in red, and lower amounts in green.
With the Slicer, the Women’s data was selected. On average, the USA team is a couple of years younger, a bit shorter and 4 pounds lighter.
For the Men, the data is similar – the USA team is a little younger, shorter and lighter.
See the Differences
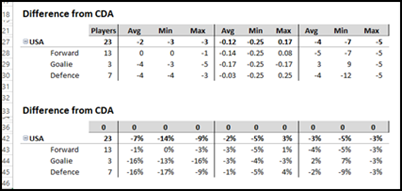
To compare the differences between the teams, I used a pivot table with custom calculations.
The first pivot table shows the difference as an amount, and the second pivot table shows the percent difference, based on the amounts for Canada.
I hid the rows for Canada, because they are empty.
More Pivot Tables
Next, I created more pivot tables and pivot charts, to show a few more differences between the hockey teams:
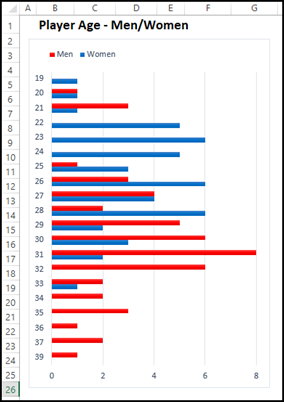
Here are the age ranges for the Men and Women players, from both countries.
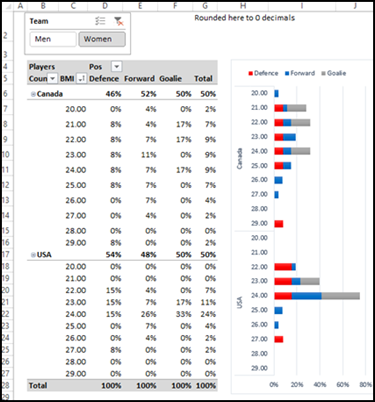
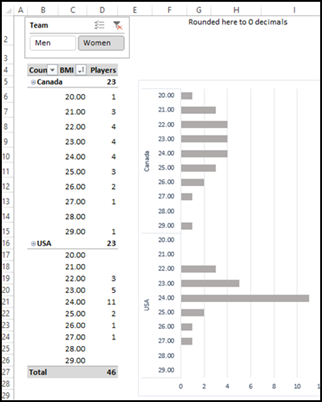
The next pivot table shows the difference between the BMIs for the Women’s teams.
This pivot table shows the player counts per BMI on each of the Women’s teams – the patterns are quite different. Was that body type difference a factor in the USA victory?
Home Town Locations
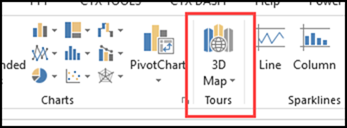
Finally, to see where the player home towns were located, I used the 3D Maps feature in Excel 2016. That command is on the Insert tab, between Charts and Sparklines.
Note: The maps are not in the sample workbook. If you have the 3D Map tool, you can build your own maps after you download my file.
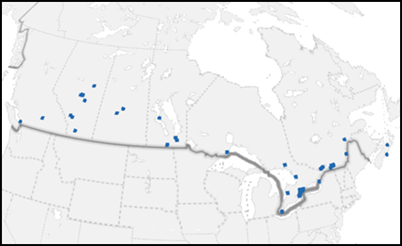
Here’s the map of home towns for all the Canadian players. They’re spread from coast to coast, with most cities close to the US border, and some further north, in the the prairie provinces.
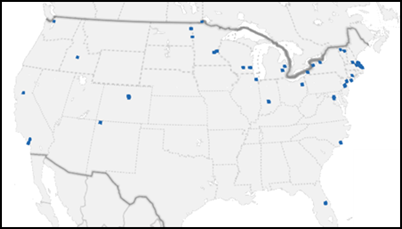
And this map shows the USA player home towns. Most are in the north and northeast, with a few scattered across the rest of the country. There were none in Alaska or Hawaii.
Why Did Team USA Win?
From data in the hockey player rosters, I can see that the USA Women team members were slightly younger, shorter and lighter, on average. Maybe that gave them an advantage against our Canadian team.
Or maybe they’re just better under the pressure of a game-deciding shootout!
Get the Player Data Analysis Workbook
To get the hockey player data analysis Excel file, and more details on the calculations and pivot tables, go to the Hockey Player Data Analysis page on my Contextures site.
The zipped file is in xlsx format, and does not contain macros.
The file does not contain the 3D map, so you can create one after you download the workbook.
Video – Gold Medal Game Highlights
Here’s a video from CBC Sports, showing some of the Women’s Hockey gold medal game highlights.
________________


One thought on “Hockey Player Data Analysis in Excel”