A couple of months ago, I shared an example with a scroll bar that selects the dates for an Excel report. There is a pivot table on a hidden sheet, and a summary report uses GetPivotData formulas to pull data from that pivot table.
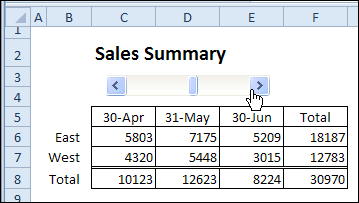
Here is a screen shot of that summary report, with the scroll bar at the top.

This technique works well when there are a few static row headings, like the East and West region names, in this example. If the row headings will change every month, or if you have a larger number of categories, my technique won’t work as well.
Filter the Data With a Scroll Bar
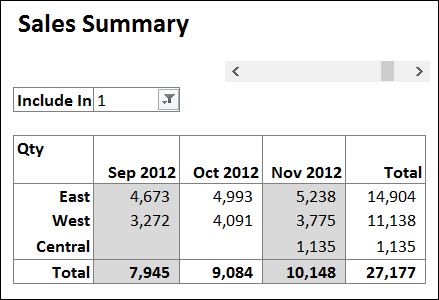
AlexJ has created a new version of that file, and he uses a pivot table as the report, instead of creating a static table. This technique gives you more flexibility, because you don’t have to set up the row headings manually.
In the screen shot below, the Central region was automatically added to the headings, because it first appears in the November data. It’s showing 3 months of data, and you can change that setting, to show more or fewer months.

How It Works
In addition to the pivot table summary, AlexJ made a few other changes to the workbook,
- It uses the first day of the month rather than the last
- Instead of the current date, the dates are driven by the latest date in the sales data.
- A new calculated field in the sales data identifies if the entry should be included in the final presentation table.
- Added a parameter to define how many months of data to show.
- One line of VBA, to refresh the pivot table, when you click the scroll bar.
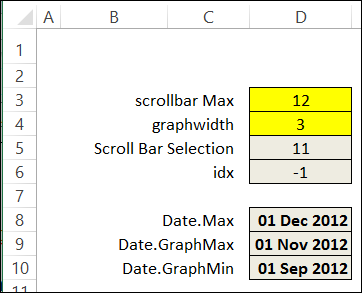
Here is the Admin sheet, where you can change the settings in the yellow cells. The grey cells have formulas that calculate the date range for the report.

Download the Sample File
To see AlexJ’s workbook, you can download his sample file. On my Contextures website, go to the AlexJ Sample Files page, and in the Pivot Tables section, look for PT0004 – Change Pivot Table Date Range With Scroll Bar.
________________

I have a use for this technique! I am going to try to build this into a workbook I maintain for one of my managers. Keep your fingers crossed – and thank you!
Glad you can use this technique JoAnn, and I hope it’s okay to uncross my fingers now!
Uncross them – it didn’t work. I think the pivot table I’m working with is too complex, at least for now. Maybe (?) I need to take baby steps.
Hi Debra,
I wasn’t sure where to ask this question, but it is in the area of this subject matter.
What I want to display in this cell is after I select my Sub Area and Downtime Cat1 and enter a specific Start Date I want to display only the data from that date an on. Right now it only displays the data from the specific date I entered.
Does that make sense? Is there a greater than function I can use on the date to capture everything from the entry date an on?
=GETPIVOTDATA(“%OEE Value”,’%OEEValue’!A3,”Sub Area”,’P1′!AL7,”Downtime Cat1″,’P1′!AK7, “Date”,’P1′!AO7)
Thanks, Matt
@Matt, the GetPivotData formula just works with an exact match.
You could add a field to the source data, to check if a record is in a selected date range. Then, use that field to filter the pivot table.
There are instructions here:
http://blog.contextures.com/archives/2009/06/08/filter-a-pivot-table-for-a-date-range/