
This week I’m working on a client’s sales plans for the upcoming fiscal year. They forecast sales per month by product and customer, and we use some pretty complicated formulas to sort things out. Of course, anywhere that it makes sense to use a pivot table, I create one. It’s a great way to summarize all the details, and review the overall totals. Running totals are easy with Excel pivot tables!
No Formulas for Pivot Tables
For example, on a worksheet you can use formulas to create a running total, but in a pivot table it’s much easier — you can quickly create running totals with a couple of mouse clicks.
Let’s take a look at an Excel pivot table based on some faked sales data. In the screen shot below, you can see the total sales per region per month, and the Grand Total per month. By changing the Sales field settings, you can show a running total, instead of the normal Sum.

Add the Running Total
To change the sales field, and show a running total, follow these steps:
-
- In the pivot table, right-click one of the Sales amount cells.
- In the context menu that appears, click Summarize Data By
- Click More Options

-
- In the Value Field Settings dialog box, click the Show Values As tab
- From the Show Values As dropdown list, select Running Total In.
- Select the Base Field where you want to see the running total. In this example, we’d like to see the running total down the list of dates, so OrderDate is selected as the Base Field.

- Click OK, to close the Value Field Settings dialog box.
The pivot table changes, to show the running total for sales.
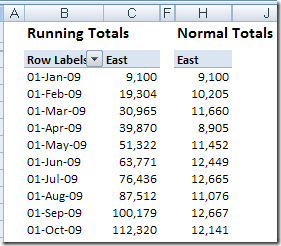
In the following screenshot, you can see the running totals in column C, and the original monthly totals in column H. Each month’s total sales is added to the previous total, to show the running total.
Change the Running Total Base Field
The most common use for running totals is to show amounts accumulated over time, as in the sales by month example above. However, you can use a non-date field as the base field for a running total. For example, in an election, you could show a running total of votes as each district submits its results. Or, for a large construction project, you could show a running total of expenses over the project phases.
In this pivot table, I’ve added City to the Column area, and used that as the Base Field for the running total.

Now, instead of the running total going down the pivot table by month, it goes across the pivot table, by city.
Be careful though — if you use a Base Field that isn’t in the pivot table layout, you’ll see #N/A for all the running total values.

Running Totals Stop at Year End
If your pivot table shows the data grouped by year and month, the running total will stop at the year end, then start over for the next year. For a workaround, there are instructions on my pivot table blog:
http://www.pivot-table.com/2013/07/17/running-total-stops-at-year-end/
Running Totals in Excel 2003 Pivot Tables
The running total technique is similar in Excel 2003 pivot table, and you can see the instructions here: Excel 2003 Pivot Table Running Totals. It also shows the results when there are multiple fields in the row area, and a running total is added to one of those fields.
Watch the Running Totals Video
To see the steps for creating running totals in Excel 2003, please watch this short Pivot Table Running Totals video.
__________
Hi, know this is an old thread, but maybe someone can help. What I’ve been counting is the number of years someone stays active in a program. I want to show a graph that starts with the total number and subtracts the count of everyone who left after one year, two years, etc. Any ideas on this?
Thank You!