This week I was travelling, and signs are really important for helping you figure out where you are, and where you should be headed.
Whether you’re posting street signs, retail signs, or worksheet instructions, try to make them clear and helpful.
Confusing Street Signs
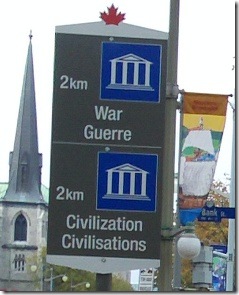
For example, this sign, in Ottawa, could have given better directional clues.
Given the choice between war and civilization, I’d want to choose wisely.
Fortunately, the distances are to the War Museum and the Museum of Civilization, but the directions could use an arrow or two!

Local Produce Availability Chart
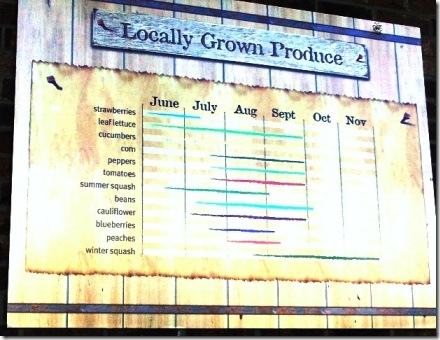
A few days later, I saw this produce chart in a grocery store in upper New York state.
The bar colours don’t show up here too well, but the chart clearly shows me when the local produce will be available in the store.
I hope you like winter squash, if you’re shopping now.
And could you create a bar chart like this in Excel?
You could try the stacked bar chart technique that we use to make an Excel Gantt chart. Then, colour the bars individually, if you have the patience for that kind of work!

Find the Farms
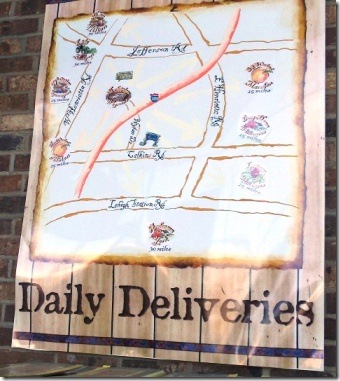
Another chart in that grocery store showed the local farms, although it’s obviously not to scale.
However, it’s nice to see where store’s food is coming from, in their daily deliveries.

Out of Stock?
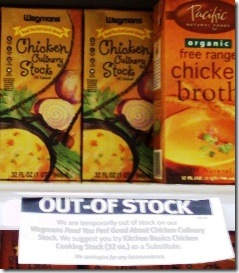
And this final sign made me laugh.
They claim to be out of stock, but the shelf is stocked with stock. Hmmmm.

________________

They might be jocking over those signs. (Laughs)