You can add a chart in Excel, based on worksheet data, but if you filter the data, and rows are hidden, that data also disappears from the chart. See how to prevent that problem from happening.
Sales Chart
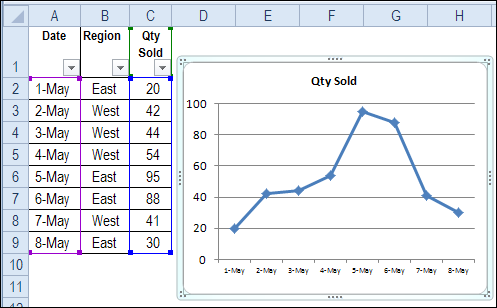
In this example, there is a line chart based on worksheet data, from cells A1:C9.
Filter the Chart Data
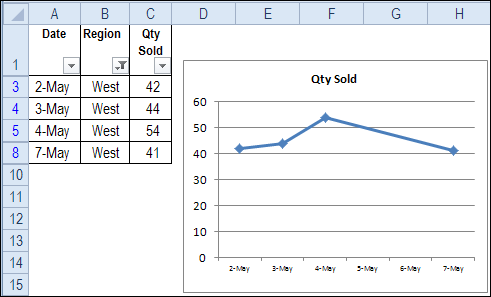
The chart looks fine, but if you filter the data, some of the worksheet rows are hidden, and that data also disappears from the chart.
In some cases, you might like that feature, and not mind that the chart changes.
In the example shown below, only the West region’s data is visible on the sheet and in the chart.
All the Data Disappears
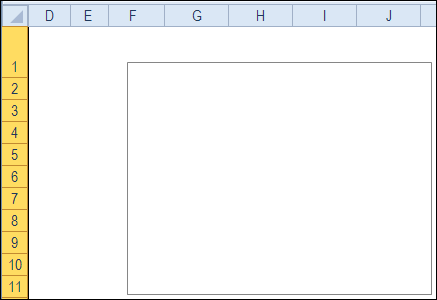
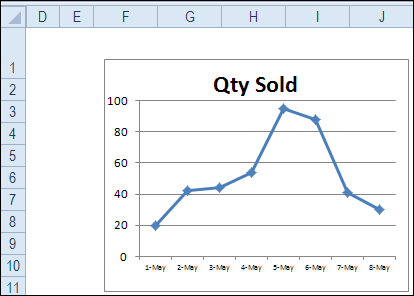
However, there are some situations when you want the chart to show the data, even if the data is hidden. In the next example, columns A:C are hidden, so that they don’t distract from the chart.
Oops! Now there’s nothing in the chart. That’s not the effect that you were going for.
Show Data From Hidden Rows
If you want your chart to show all the data, even if some of the source data is hidden, you can change one of the chart settings.
The Excel 2010 instructions are shown below, and you can click here for instructions to show hidden data in Excel 2003 charts.
To change the setting in Excel 2010:
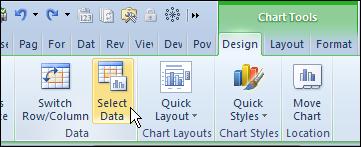
- Click on the chart to select it, and on the Excel Ribbon, under Chart Tools, click the Design tab
- Click the Select Data command
- Click the Hidden and Empty Cells button

- Add a check mark to ‘Show data in hidden rows and columns’
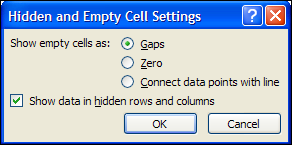
- Click OK, twice, to close the dialog boxes
Now, you can hide rows or columns, and the chart data will remain visible.
Test the Hidden Data Feature
To see the difference this option setting makes, test the feature in this embedded Excel file. Filter the Region, and one chart continues to show all the data, but the other chart has hidden data.
Watch the Show Hidden Data in Chart Video
To see the steps for changing the chart settings in Excel 2010, to show data from hidden rows in Excel chart, watch this short video.
__________________

Great! Thanks for the tips.
A great tip, revealing one of Excel’s many (well) hidden settings.
The only thing I would like to add is that, where possible, try not to hide content. Instead structure your spreadsheets as Input > Workings > Outputs. Using this structure you can have Working tabs driving your charts (with no need to hide rows) and Output tabs showing just the information that the end user needs to see.
Myles
Thanks a lot! Great Tutorial.
Thanks for your help! I have used a couple of your pointers and they are exactly what I am looking for!!
Thank you!, just what a needed
I am not using a graph, but when I use the following:
=Sheet1!BJ72 and then hide that column it I have equalled from, it does not show my value.
How can I hide the column and still see this on the master sheet?
It really helpful for me