I’m working on some pricing reports for a client, and one of the requests was for a Pocket Price Waterfall chart. I hadn’t made one of those before, and fortunately the client sent me a sketch of the chart that they wanted.
The Pocket Price Waterfall chart sketch looked something like this.

The good news was that it looked similar to other waterfall charts that I’ve made. However, instead of two highlighted columns, to show start and finish, it had several highlighted columns.
The Pocket Price
The term “pocket price” was new to me, and some Googling led me to an article published by McKinsey & Company in 2003 – The Power of Pricing. They coined the term “Pocket Price” to describe the amount that you actually get from a customer, after the hidden costs and off-invoice discounts that might exist.
The article shows a waterfall chart, similar to the one that my client wanted. Maybe that’s where they got the idea!
Add the Extra Columns
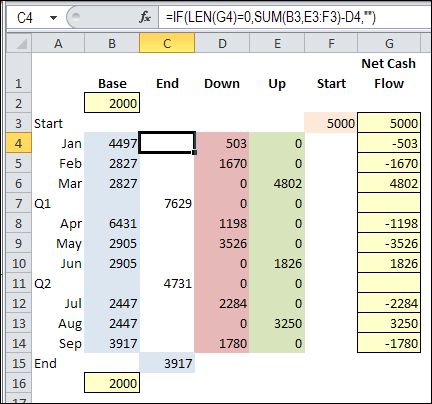
To experiment with adding more highlighted columns, I started with the cash flow waterfall chart from a previous blog post, and added rows for the Quarterly totals. In the previous version, there was only one number in the End column, and I needed a number in each Quarter row, where I wanted a highlighted column.
I created a new formula in the End column, cells C4:C14, to check the Net Cash Flow column (G). If that cell is empty, show the sum of the previous amounts.
=IF(LEN(G4)=0,SUM(B3,E3:F3)-D4,””)
The Base column is the reverse, showing the sum if the cell in column G is NOT empty.
=IF(LEN(G4)=0,””,SUM(B3:C3,E3:F3)-D4)

The Revised Waterfall Chart
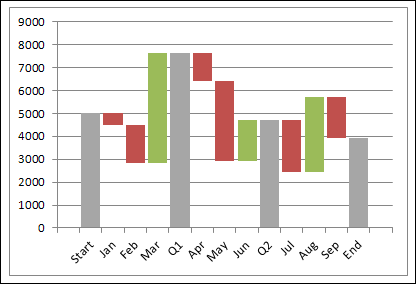
Here is the revised waterfall chart, with a highlighted column for each quarterly total, ending in September.

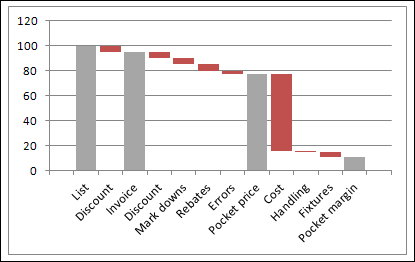
Then, I used the same formulas with some faked Pocket Price data, to create the Pocket Price waterfall chart. There aren’t any green columns, because all of the values are negative amounts, bringing down the price.

And now I’m ready to create the real Pocket Price waterfall chart, whenever we get to that stage in the project.
Get the Sample File
To see the waterfall charts and the worksheet formulas, you can download the Pocket Price Waterfall Chart workbook from the Excel Waterfall Charts page on my Contextures site.
The file is in xlsx format, and zipped. There are no macros in the file.
Watch the Waterfall Chart Video
To see the steps for setting up your data, and creating an Excel Waterfall Chart, you can watch this Excel video.
Then, make the formula changes in the Base and End columns, to create a Pocket Waterfall chart.
_____________

Very cool. Thanks for posting!
Very helpful. Thanks.