In this week’s roundup, see the results from the last roundup’s pivot table survey, build a better dashboard, see some new chart types, and much more.
We’re almost at the end of our summer schedule now, and the next roundup will be published on Monday, Sept 14th.

Video: Excel Roundup 20150831
Watch this short video, with highlights from the Excel Roundup 20150831. Written details and links are below the video.
1. Excel Pivot Table Survey
In the August 17th roundup, I asked for your opinion in a short survey, and thank you for all the responses. There were 3 questions:
- Do you use Excel pivot tables?
- If you use pivot tables, what is your skill level? From 1 (very low) to 10 (awesome)
- How do you feel about pivot tables? Scale of 1 (Hate) to 10 (Love)
Most of the respondents use pivot tables, but the percentage is likely lower in the overall Excel user population. People who don’t use pivot tables were less likely to fill in the survey. Before you look at the results, can you predict the outcome?
- What was the average skill level?
- What was the average love/hate rating?
You can see the answers in this interactive workbook, shown below. If you can’t see the workbook in your browser, you can download it from my Contextures website. Go to the Sample Files page, and in the Pivot Tables section, look for PT0042 – Results from Pivot Table Survey.
2. Worksheet Navigation Tips
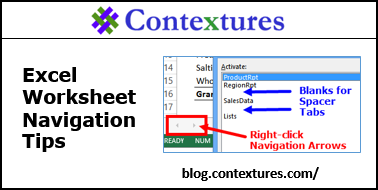
Do you have trouble finding a specific worksheet in a large Excel file? AlexJ shared his worksheet navigations tips, and I added a couple of my own tips. See how to use the navigation arrows, popup sheet list, coloured tabs, and spacers tabs.
3. Pivot Table Top 10 Filter on Worksheet
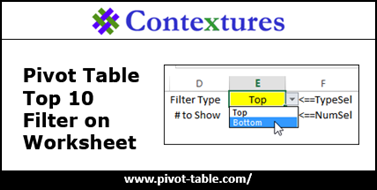
In a Pivot Table top 10 filter, you can’t link to worksheet cells for the settings. However, with a bit of programming, so you can control the filter with worksheet drop downs. Download the sample file to see how it works.

4. Excel Spirograph
Apparently “adult colouring books” are a thing now, and you can buy them on Amazon, then spend hours filling in the intricate designs. Or, if you’re frugal (like me!), you could create your own fancy designs in Excel, using the Excel Spirograph template from Jon Wittwer’s Vertex42 website. You’ll save money, and see how a cool Excel chart works.
5. Designing a Dashboard
On her Excel for Educators blog, The Science Goddess shows the steps that she went through, while designing dashboards to show student performance in different grades and subjects, over 4 years. See the different versions that she created, for demographic and achievement data, and the final results. You’ll get good ideas for your own dashboards.
On his blog, Chandoo shows how to show pivot table data in a dashboard, by using the GetPivotData function. I love that function, and you can find more examples and videos on the GetPivotData page on my Contextures website.
6. New Excel Chart Types
On Microsoft’s Excel Team blog, you can see three of the new chart types that are in Excel 2016. These are statistical charts – Histogram, Pareto and Box and Whisker. The article explains how each chart type works, with sample data and the resulting chart. There is a link where you can download the Office 2016 preview, and then try the new chart types for yourself.
7. Excel Tips
On the Lifehacker blog, I saw a link to this post on 8 Great Tools to Make You an Excel Expert. Most of the tips are okay, but beware of tip #7 – “Control Decimals with the FIXED Function”. The result of a FIXED formula is text, not a number, so their value will be zero if you include those cells in a total. You should use Round, or one of the other rounding functions from the Math category, unless you just want the numbers to look pretty, and not use them in any totals.
REMEMBER: If you want really great Excel tips, get a copy of Bill Jelen’s (Mr. Excel) latest book, Mr. Excel XL – The 40 Greatest Excel Tips of All Time. It will be released tomorrow, September 1st.
8. Excel Announcements
- John Michaloudis is launching his new Excel podcast this week. To celebrate, John is giving away some awesome Excel courses and add-ins. To participate in the fun, subscribe to the podcast and leave an honest review. Get all the details here.
- Register for the free online course – Analyzing and Visualizing Data with Excel – at the Microsoft Virtual Academy. The course has about 2 hours of short, lecture-based videos, along with demos, quizzes, and hands-on labs. (Level – Intermediate/Advanced)
- Registration is now open for the 4th Annual Financial Modeling World Championships, which begins Saturday October 17, 2015 . There are two online rounds and the top 16 competitors will be flown to London UK for the ModelOff 2015 Finals. Sign up now, on the registration page.
9. Excel Humour
Finally, for a bit of spreadsheet humour, you can see what people are saying about Excel, in my weekly collection of tweets. Here’s one of my favourite tweets from this week’s collection.

________________


