Do you use the sparklines that were introduced in Excel 2010? Last week, I was building a dashboard, and wanted to show sparklines for expenses and revenue.
It didn’t go smoothly at first, but I finally got things working, and then I ran into another hurdle! Here’s what went wrong, and how I fixed things.
Create a Sparkline Group
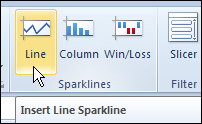
In this example, I had expenses and revenue in alternating columns, and I wanted expense sparklines in cells C4:C14. So, I selected those cells, and on the Ribbon’s Insert tab, click the Line command in Sparklines.
In the Create Sparklines dialog box, I selected the first range of expense cells, then pressed the Ctrl key, and selected the other two ranges.
When I clicked OK, an error message appeared — “The reference for the location or data range is not valid.”
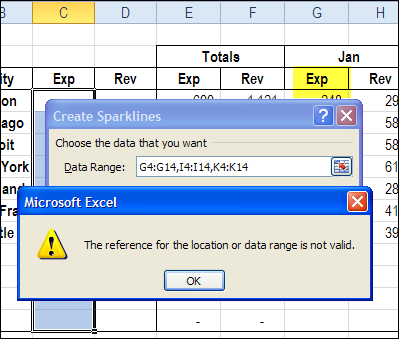
Apparently the sparklines need a contiguous range, and won’t work with non-contiguous ranges.
Create Data for the Sparklines
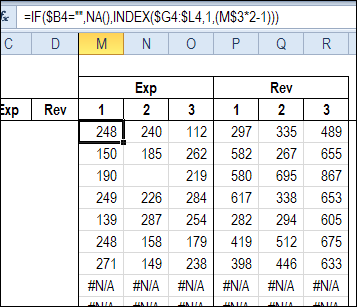
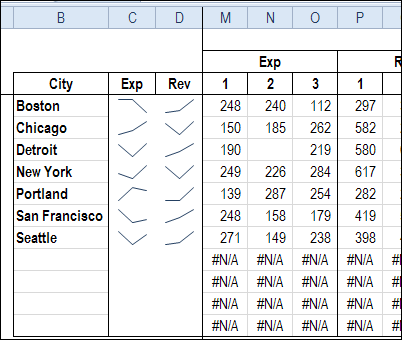
To create a contiguous range of data that the sparklines could use, I set up Expense and Revenue sections to the right of the existing data.
Then, I used formulas to link to the existing data, and show an NA if there was no city name in column B.
=IF($B4=””,NA(),INDEX($G4:$L4,1,(M$3*2-1)))
Create the Sparklines
Next, I selected the cells where the sparklines should appear, and selected the Expense data in the linked range.
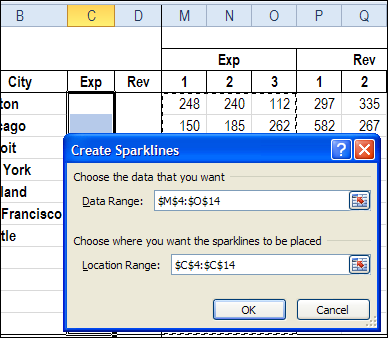
That worked perfectly! I then set up the Revenue sparklines in column D.
Hide the Sparkline Data
Once the sparklines were set up, I decided to clean up the sheet, so I hid the columns with the sparkline data. Unfortunately, the sparklines disappeared too!
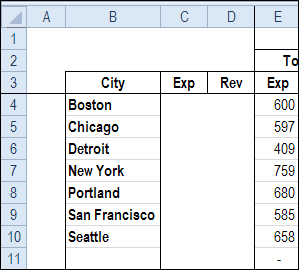
Regular Excel charts have a setting that you can change, to show hidden data, so I figured that Sparklines must have a similar setting.
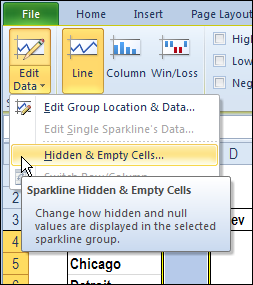
I selected the Expense sparkline group, and on the Ribbon, under Sparkline Tools, clicked Edit Data.
There was a Hidden & Empty Cells command, which sounded promising, so I clicked that.
In the Hidden and Empty Cell Settings dialog box, I clicked Show Data in Hidden Rows and Columns, to add a check mark, and clicked OK.
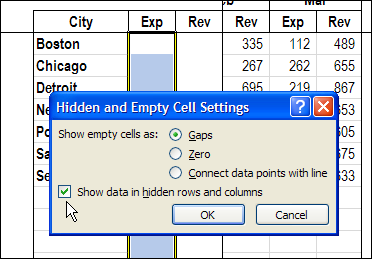
Hurray! The Expense sparkline group reappeared.
Change Multiple Sparkline Groups
Next, I had to change the Revenue sparkline group settings, so I selected those cells. In Excel, you can press the F4 key to repeat the last action, but that doesn’t work for sparkline settings, apparently. So, I had to follow the same steps to open the dialog box, and change the Revenue sparkline settings.
In the example shown here, there are only two sparkline groups, but in my actual file there were about 20 groups. I tried selecting two sparkline groups, to change their settings at the same time, but the Edit Data command isn’t available in that situation.
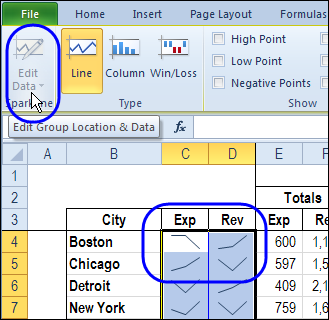
So, I decided to write a macro that would change all the sparkline groups on the active sheet. The code worked really well, and it should come in handy if I create sparklines in a different workbook. And I hope it helps you too!
Sub SparklinesFix()
Dim spk As SparklineGroup
For Each spk In ActiveSheet.Cells.SparklineGroups
    spk.DisplayBlanksAs = xlNotPlotted
    spk.DisplayHidden = True
Next spk
End Sub
Download the Sample File
To download the sample file, please visit the Excel Templates page on my Contextures website. In the Charts section, look for CH0007 – Show Sparklines for Hidden Data. The file will work in Excel 2010, but sparklines are not available in earlier versions.
____________________

One thought on “Show Excel Sparklines for Hidden Data”