 How bad is the economy? With FRED, the free Excel add-in from the St. Louis Federal Reserve, you can easily download and and analyze economic data.
Install the Add-In
Just download and install the FRED Excel Add-in, then select and download data. Then, start your analysis:
- choose a data manipulation (i.e., growth rate)
- specify a date range (i.e., 1960:Q1 to 2010:Q4)
- aggregate data to lower frequency (i.e., weekly to monthly)
- search for data, and
- browse the most popular data series.
Getting Started
If you’re not familiar with the FRED website, take a quick look at the FRED Add-in’s user guide, to help get started.
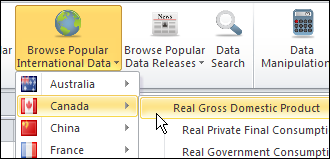
The key to pulling data is to enter a series name, so if you don’t have those memorized, select one of the Popular Data options, to get its Series ID.

Or, use the Data Search button to find the series that you need. For example, I clicked the button, then typed Canada as the search term. This took me to the FRED website, showing a list of economic data series.
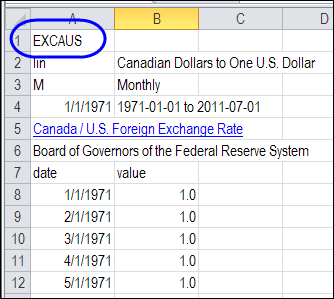
I found one that looked interesting, and pasted its ID into cell A1 on the worksheet.
Pull the Data
After you’ve entered a Series ID in cell A1, you can enter a Data Manipulation code in B1 and Frequency Aggregation code in cell C1. Or, leave those cells blank.

Click the Get FRED Data button, and the data downloads onto the worksheet – ready to analyze.

Make a Chart
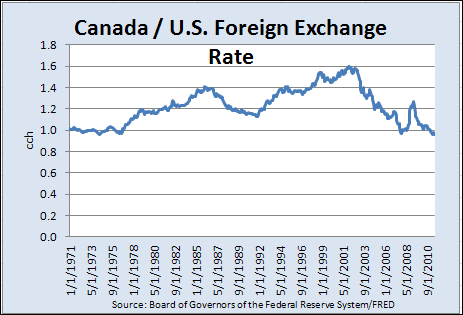
The FRED Add-in makes quick charts too – just click the Build Graph button, after you download the data.

Have You Tried FRED?
Have you used the FRED Add-in for Excel? Did you like it? Wish it had more features? The FRED website talks about adding more features in future versions, so if you have some ideas, let the FRED people know!
______________
