 If you’re looking for love, move along — the “Canadian Singles” in the article title refers to hit songs, not eligible bachelors.
Last week, a new book was published with a list of top 100 Canadian singles, based on a poll of music professionals and fans.
In his J-Walk blog, John Walkenbach posted a link to the Canada’s Top 100 Singles list, and there was a lively discussion in the comments section.
Top 100 Canadian Singles List
No discussion is complete without a spreadsheet, so I copied the list into Excel, and cleaned it up.
To make it more interesting, I found the release date for each hit song, and split them into decades, using the Excel FLOOR function.
Make a Pivot Table
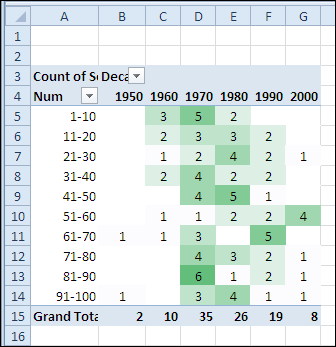
From that data, I created a pivot table, showing the count of songs from each decade, listed by rank.
Was most of the best music released in the 1970s, or were most of the voters from that era?
Pivot Table Group Numbers by 10
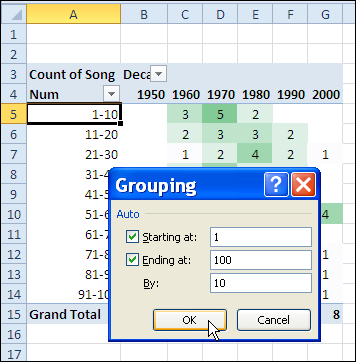
In column A, the top 100 songs are grouped by 10s, to summarize the data.
For example, row 5 shows the decade counts for the songs ranked from one to ten in the top 100 list.
Highlight with Color Scale
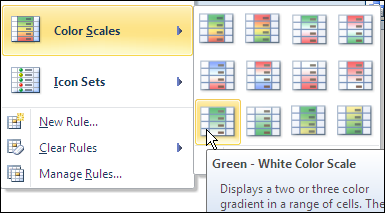
Next, I added conditional formatting to highlight the decades with the largest number of songs.
Repeat Pivot Table Item Labels
A new feature in Excel 2010 pivot tables is the ability to repeat the field item labels.
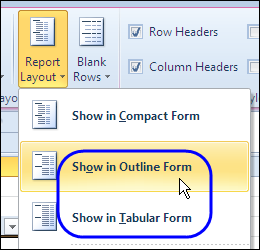
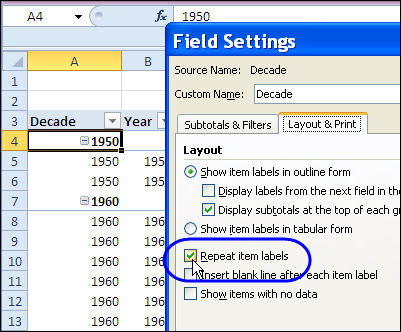
In another copy of the pivot table, I put the decade in the row label area, and changed the pivot table report layout to Outline Form.
Change Pivot Field Setting
Then, I right-clicked on the Decade field, and clicked Field Settings. On the Layout & Print tab, I added a check mark to Repeat Item Labels, and clicked OK.
After changing that setting, the decade is repeated in each row, instead of showing just once, at the top of the section.
Download the Top 100 Canadian Single File
To see the list, and create your own pivot table, you can download one of my sample files.
- There’s a Top 100 Canadian Singles list in Excel 2007/2010 format
- For earlier versions of Excel, download the Top 100 Canadian Singles list in Excel 2003 format.
_______________

Dear,
the 2003 file requested me for a password to download it. is that OK?
I wanna know more about FLOOR !!
rgds.
Debra,
thanks for the file. I am bragging now at the office I’ve learned a new Excel function, and everybody seems amazed there were something I didn’t know about Excel….
I use to group people ages in a pivot table, the same way you explained, but I believe this function is better when it comes to send plain data to clients, instead of summaries.
a question arised, then: suppose I want to assign different “decades”, i.e, “older than 60’s”,”60’s”,”70’s”, “80’s”,”early 90’s”, “late 90’s”, “00’s”, and so on…
what would be your approach???
thanks,
Martin
Martin, you’re welcome, and it’s great to find new things in Excel.
To group in different decades, you could use a lookup table, with the start date for each group, pull the decade description from that table.
[…] Top 100 Canadian Singles in Excel […]
curious: is there a “Repeat Item Labels” feature in Excel 2007’s PivotTable?
i cant seem to find it anywhere.
thanks1