
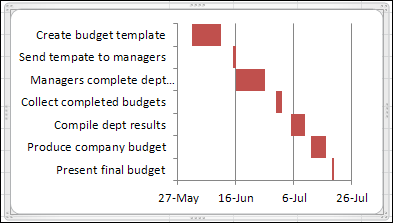
“In the back of my mind, I always knew that charts would help me,” says the market researcher in this promotional video from 1982. Wow, did you really have to wait weeks for your data processing department to make your charts, back in the old days?
The graphs haven’t changed much in the 28 years since this video, Introduction to Business Graphics, was filmed, but at least the presentation technology has improved.
Do you remember using those gigantic overhead projectors, and scrambling to get your transparencies ready in time for the meeting?
Apple Business Graphics
To ease some of that pain, you could buy a copy of Apple Business Graphics, and use it on your desktop computer.
I grabbed this screen shot while watching the video,
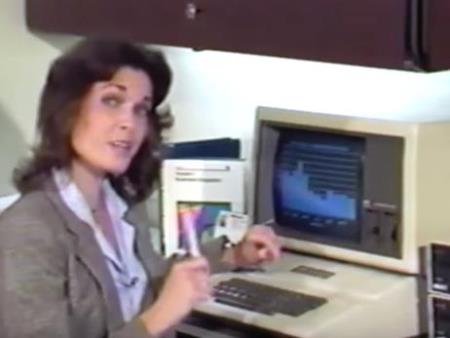
Apparently, Apple Business Graphics wasn’t quite as popular as Excel became, a few years later, because the announcer boasted that Business Graphics was currently being used in “over 6000 offices”.
Blast from the Past Video
Here’s the 6-minute video, from 1982, explaining the benefits of Apple Business Graphics.
Video Timeline
- 0:00 Title and Credits
- 0:28 Information War
- 1:03 Business Graphics
- 2:00 How It Works
- 3:40 Using Your Data
- 4:18 Graphs from VisiCalc
- 5:02 Printing Graphs
- 5:43 Other Graphic Programs
If you want to make your Excel charts look like they were made today, instead of 1982, see the Excel Charting tutorials on Jon Peltier’s blog.
Excel Demo – 1988
For a few more examples of business graphics in the 1980s, you can watch this episode of Computer Chronicles, from 1988. The Excel demo starts at the 6:27 mark.
Chart Tutorials on Contextures Site
For more charting tutorials, follow these links to my Contextures site:
Box Plot (Box and Whisker) Charts
________
Wow… what a trip down memory lane. I remember feeling “special” because the IT folks gave me the code to get into the computer room arond 1983, which I needed because HP had special charting software that I think cost $5k. So glad things have progressed!