Last month, I wrote about Tableau dashboards, and my first experiences with creating a Tableau workbook from Excel data.
In this post, you’ll see another sample dashboard, where you can experiment with the user controls.
Select one or more days of the week, or highlight a sales representative.
Tableau Dashboard
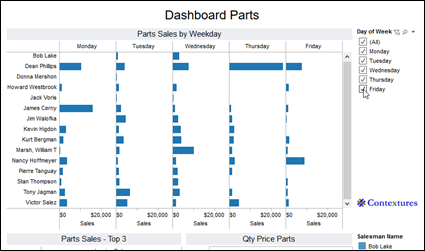
Here’s a screen shot of the Tableau dashboard, that focuses on Parts sales for each sales representative.
You can see the sales amounts per day of the week, average price compared to quantity sold, and the top three sales reps for parts.
To try the interactive features, go to the dashboard on the Public Tableau site.

Make Dashboards in Excel
You can make fancy, interactive dashboards in Excel too! For examples, tips, videos and ideas, go to the following dashboard pages on my Contextures site:
Dashboard Course Review – A detailed review of Mynda Treacy’s online Excel Dashboard course, which she opens 3-4 times each year, on her website.
Dashboard Problems Survey Results – I ran a survey, to ask if people used Excel Dashboards – Yes or No, and what problems they encountered. The detailed results and replies are shown on this page
Dashboard Templates– This page has sample Excel dashboard templates that you can download, to help you get started, or add new features to your existing dashboards
Dashboard Tips – These examples show common Excel dashboard mistakes, and how to fix them
_________________

Video comments: Because this data came from actual altered client information that I supplied Debra, I’d like to point out a few subtle items. In the video Debra is joins multiple “tables” which are actually tabs in the spreadsheet. The tabs have the prefixes FACT (for a fact table containing numbers) and DIM (for a dimension tab containing sorting and filtering information). This replicates the type of structure that would be contained in a real star-schema database.
The JOIN clauses invoked when Debra joins the DIMdate and DIMShipTo tables perform work just like they would if she was connecting to a large enterprise-class database. This is why High Value Low Cost BI solutions are now within reach of small companies. By invoking a LEFT join type when joining the FACT table to the DIMENSION tables in this spreadsheet, you now have an easy way to identify missing or incorrect data elements in your source system. This is exactly how I implemented a data warehouse at 10% of the quoted cost from typical BI vendors because I didn’t have to pay consultants to cleanup the errors (everyone has them) in my granular billing data.
Sales Dashboard: Another “advanced” feature that I would love to see Debra demonstrate in a future post would be the addition of “Actions” filters. Actions allow you to control dependencies in the filtering. For example, Debra could add another table displaying parts sales by part number descending dollar volume, then add an action filter to allow the user to click on a single part number and see the average price displayed in the Quantity Price Parts for an individual SKU versus all part SKU’s. See Visual Analysis, Filter Actions here:
http://www.tableausoftware.com/community/support/quickstart
The quickstart guide can be downloaded as a 1-page pdf which clearly demonstrates how you can add action filters.
In case you weren’t aware…
http://online.wsj.com/article/SB125475547130664753.html?mod=WSJ_hpp_MIDDLENexttoWhatsNewsTop
Jim;
Thank you for sharing that in Jim. I saw an article last night on the news but didn’t have a chance to read the guidelines until this morning.
Full disclosure: I work for InterWorks Inc., who is a reseller of Tableau software. I did not receive gifts or payment of any kind related to posts I’ve made on this blog (or any other blog, including my own) for comments that I’ve made regarding Tableau Software. I’ve had great experiences with the product. I hope other folks can achieve the same.